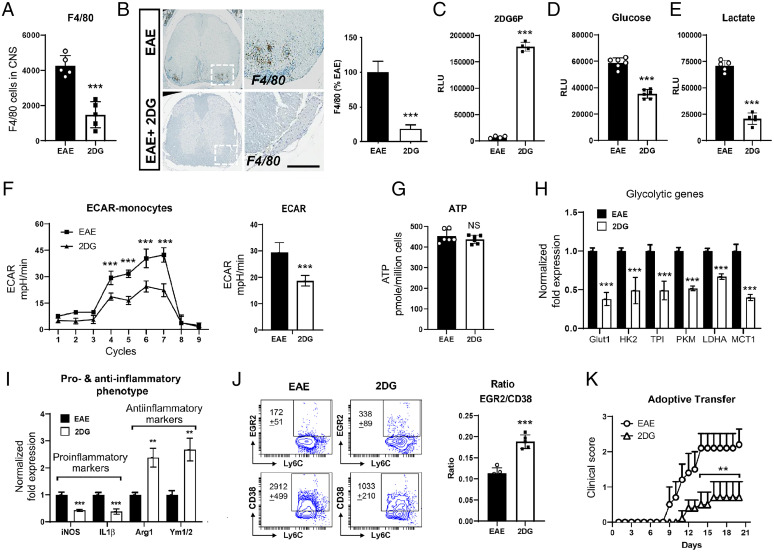
Fig. 6.
2-Deoxy-glucose induced antiinflammatory phenotype of monocytes by abrogating glycolytic metabolic pathway. (A) Quantitation of CD45+F4/80+ infiltrated macrophage number in the spinal cord and brain of EAE- and 2DG-treated (drinking water) groups. The data presented are the mean ± SD of six animals per group. (B) Representative immunohistochemical staining and quantitative analysis for F4/80+ cell infiltration in EAE induced mice with or without 2DG treatment in drinking water. Data were shown as mean ± SD (n = 6 mice per group). Scale bar,100 µm. Statistical analysis was done by Student’s t test. Statistical significance was determined at P < 0.05. (C) Isolated monocytes (20,000 cells) from spleen cells from both groups were processed for the detection of 2 deoxy-glucose-6-phosphate (2DG6P) using Glucose Uptake-Glo Assay kit from Promega. The data presented are the mean ± SD of four values. (D, E) Isolated monocytes (> 92%) from spleen cells from both groups were plated (20 K per well) in 96-well plate and post 24 h, cell supernatant was processed for glucose and lactate measurement for determination of glucose consumption and lactate release in media. The data presented are the mean ± SD of six values per group. (F) Isolated monocytes from spleen cells from both groups were processed for glycolysis measurement using Seahorse Bioanalyzer (n = 8 per group). (G) ATP was measured in isolated monocytes using ATPlite luminescence assay kit from Perkin-Elmer. The data presented are the mean ± SD of six values per group. (H) Expression of glycolytic genes including glucose transporter 1 (Glut 1), hexokinase 2 (HK2), triose-phosphate isomerase (TPI), pyruvate kinase M (PKM), LDHA, and monocarboxylate transporter 1 (MCT1) were examined in isolated monocytes from both groups using quantitative PCR. Expression of glycolytic genes were normalized with the control gene; ribosomal L27 housekeeping gene. The data presented are the mean ± SD of four values per group. (I) Expression of proinflammatory (iNOS and IL-1β] and antiinflammatory (arginase 1 [Arg-1] and chitinase-like 3 [Ym1/2]) specific genes were examined in isolated monocytes from both groups using quantitative PCR and normalized with the control gene; ribosomal L27 housekeeping gene. The data presented are the mean ± SD of four values per group. (J) The ratio of EGR2 and CD38, a marker for antiinflammatory and proinflammatory were examined on Ly6C+ cells gated on CD11b+Ly6G− population by flow cytometry in the spleen of treated and untreated EAE group with 2DG on day 20 postimmunization. (K) Adoptive transfer of monocytes from EAE and 2DG treated EAE groups on day 6 in B6 mice immunized with MOG35-55. The data presented are the mean ± SEM of five animals per group. n = 4 to 6 per group; *P < 0.05, **P < 0.01, and ***P < 0.001. Student t test, one-way ANOVA.

