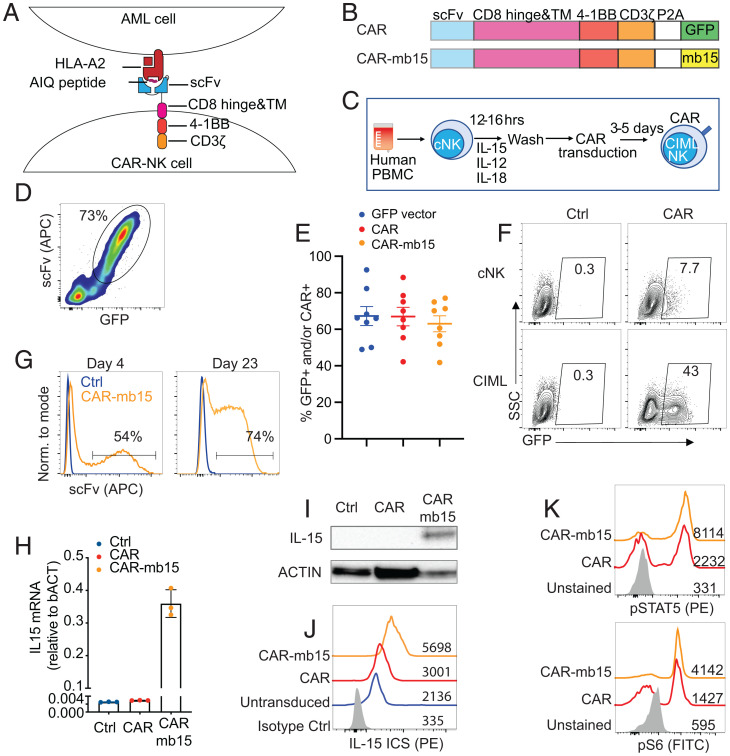
Fig. 1.
Generation of NPM1c-specific CAR-CIML NK cells. (A) Schematic diagram showing the design of CAR constructs and recognition of the AIQ/HLA-A2 complex on AML cells by NPM1c-CARs in B. (C) Schematic diagram showing the differentiation of freshly purified PB cNK cells into CIML NK cells and their transduction by BaEV-pseudotyped lentivirus. PBMC, peripheral blood mononuclear cell. (D) Representative flow cytometry plot showing expression of the NPM1c-CAR and GFP on transduced CIML NK cells. (E) Summary data showing transduction efficiencies of CIML NK cells from different donors with lentiviruses expressing GFP (blue dots), NPM1c-CAR (red dots), or NPM1c-CAR-mb15 (orange dots). (F) Comparison of transduction efficiency in cNK and CIML NK cells from a representative donor. Transduced cells were analyzed for GFP expression after 72 h, using untransduced cNK or CIML NK cells as controls (Ctrl). The numbers indicate percentages of cells in the gated area. (G) Representative flow cytometry histograms showing surface CAR expression of the untransduced (Ctrl in blue) and CAR-mb15-transduced (orange) CIML NK cells at day 4 and day 23 posttransduction. (H) qPCR quantification of IL15 transcripts and (I) Western blotting of IL-15 protein in CIML NK cells without transduction (Ctrl) or transduced with CAR or CAR-mb15. (J) Intracellular staining (ICS) of IL-15 in untransduced and CAR and CAR-mb15 transduced CIML NK cells by flow cytometry. Gray, blue, red, and orange histograms show isotype controls, untransduced, and CAR- and CAR-mb15 transduced CIML NK cells, respectively. (K) Flow cytometry assays for pSTAT5 (Upper Panel) and S6 kinase (Bottom Panel) in CAR and CAR-mb15 transduced CIML NK cells. Gray, red, and orange histograms show unstained controls and CAR- and CAR-mb15 transduced CIML NK cells, respectively. Data are representative of five (D) or three (F–K) independent experiments. Data in H show representative results using CIML NK cells from one PB donor, with error bars representing mean with SD from technical triplicates. Data in E are pooled from five independent experiments, with each dot representing one different PB donor; n = 8 for each column and error bars represented mean with SEM.

