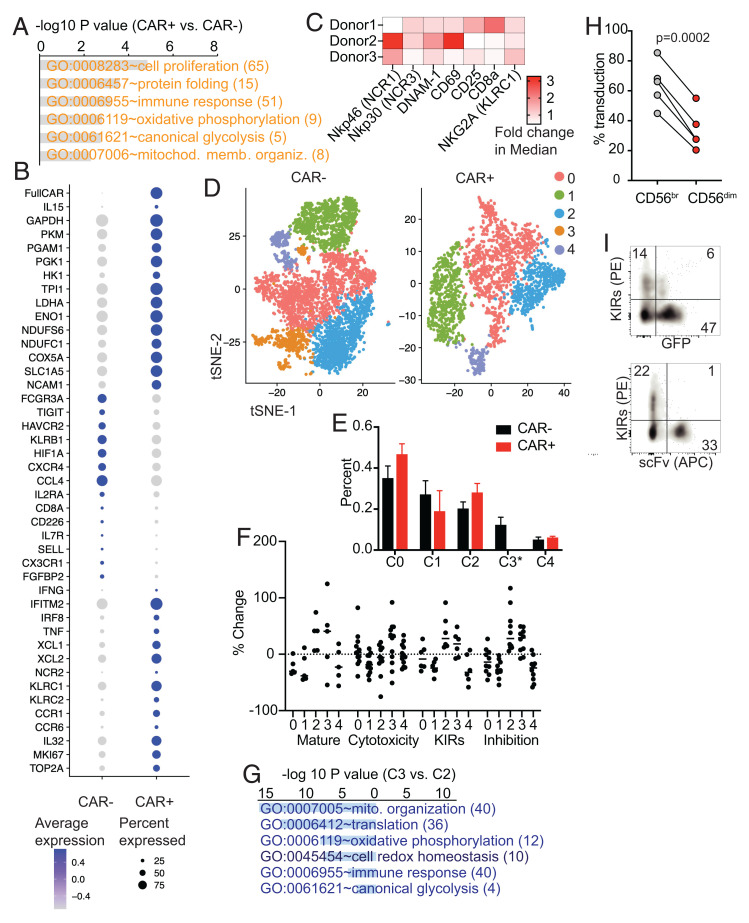
Fig. 2.
scRNA-seq and mass cytometry characterization of BaEV LV-transduced CAR-mb15 CIML NK cells. (A) GO functional enrichment analysis of DEGs between the CAR+ and CAR− CIML NK cells (n = 2). DEGs were computed by FindMarkers between CAR+ and CAR− populations with log2 fold-change of >0.1 and P < 0.05. (B) Dotplot of the expression of selected DEGs. (C) Heatmap of fold changes of selected NK cell activation and functional proteins between CAR+ and CAR− CIML NK cells based on mass cytometry analysis. (D) tSNE clustering analysis of scRNA-seq data from CAR+ CIML NK cells (Right) and CAR− CIML NK cells (Left). Each cluster between CAR+ and CAR− cells was annotated based on the expression similarity of 2,000 variable genes. (E) Cell proportion of each cluster in CAR+ and CAR− CIML NK cells. Note that cluster 3 was absent in CAR+ CIML NK cells. (F) The scores for maturation, cytotoxicity, KIR, and inhibition in each cluster. Each dot represents one gene in that cluster and category (SI Appendix, Materials and Methods). The score was calculated from the change of its expression to the average expression of all cells. (G) GO functional enrichment analysis of DEGs between cluster 3 and cluster 2 in CAR− CIML NK cells. (H) Flow cytometry analysis of BaEV lentiviral transduction of CD56brigh (immature) versus CD56dim (mature) NK cells. (I) Representative flow cytometry plots showing negative correlation between KIR expression and CAR transduction with BaEV pseudotyped lentivirus expressing NPM1c-CAR and GFP. n = 3 (C), 2 (E), 5 (H) PB donors. Error bars in E represented mean with SD. Data in H were analyzed by two-tailed paired t test. Data are pooled from two (C) or three (H) independent experiments, or representative of two independent experiments (I).

