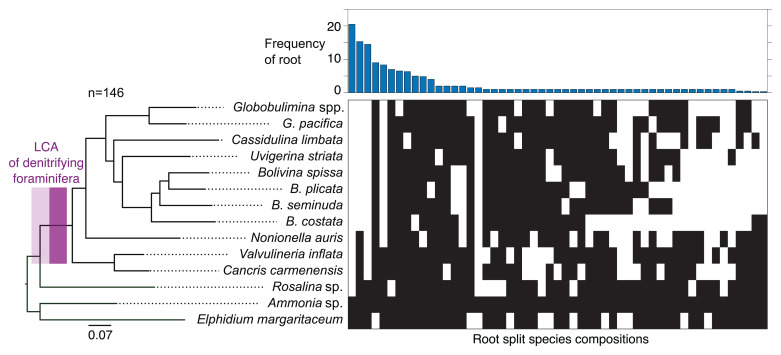
Fig. 2.
Phylogenetic rooting of rotaliids. A maximum-likelihood phylogenetic reconstruction of foraminiferal species from 146 eukaryotic protein marker sequences is shown on the Left. The branch with the LCA of denitrifying foraminifera is highlighted in purple, where a lighter color includes lower bound for the origin of denitrification. Nonparametric bootstrap support is 1,000/1,000 at all the branches. A split representation of root splits determined via the MAD approach for the 146 single gene trees is shown on the Right. Each column represents a putative root branch reported as split of two groups (black and white boxes) indicating the species found on either side of the branch. The bar graph reports the single gene tree count supporting the corresponding root split.

