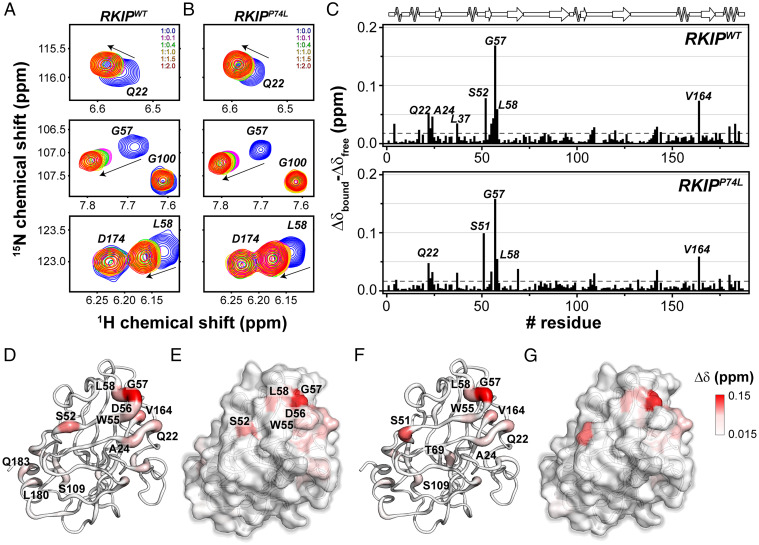
Fig. 4.
NMR map of the residues of RKIPWT and P74L mutant involved in PKA-C/RKIP interaction interface. (A and B) [1H,15N]-HSQC spectra showing the backbone chemical shift changes of selected resonances of (A) RKIPWT and (B) RKIPP74L upon titration of increasing amount of PKA-C/ATPγN complex. (C) CSP of the amide fingerprint of RKIPWT and RKIPP74L mutant alone (Δδfree) and in a 1:2 complex with PKA-C/ATPγN (Δδbound) vs. residues, calculated using Eq. 1. The residues that show a CSP value two times greater than 1 SD from the average CSP (gray dashed line) are indicated in the histogram. (D–G) Cartoon (D) and surface (E) mapping of the amide CSP of RKIPWT or cartoon (F) and surface (G) of P74L mutant onto the three-dimensional structure (Protein Data Bank [PDB] ID 2IQY). The cartoons and the surfaces are colored according the CSP values ranging from 0.015 to 0.15 ppm.

