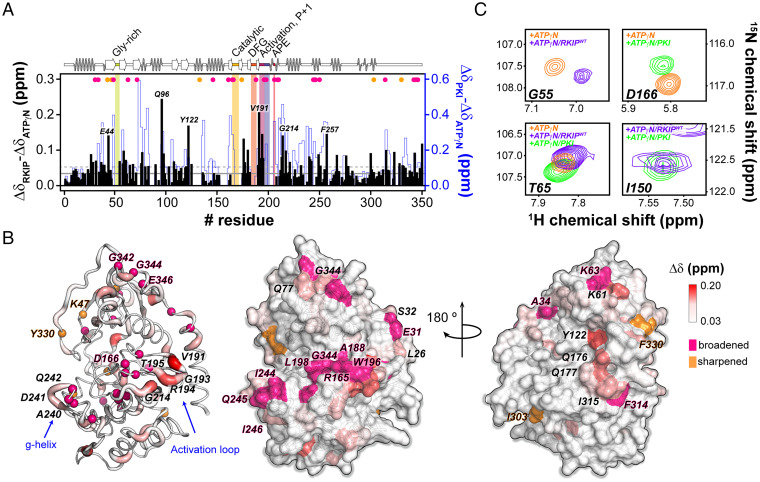
Fig. 5.
NMR mapping of the PKA-C residues involved in the PKA-C/RKIP interactions. (A) CSPs of the PKA-C/ATPγN fingerprint upon interaction with RKIPWT (black) and PKI. The shaded colors indicate the Gly-rich loop (green), catalytic loop (yellow), DFG loop (orange), activation loop (purple), P + 1 loop (blue), and APE (red). (B) Chemical shift changes mapped onto the PKA-C structure (PDB ID 4wb5). The hot pink spheres highlight residues that broaden out, while the orange spheres indicate those residues that sharpened out upon interacting with RKIPWT. (C) [1H,15N]-TROSY-HSQC spectra overlay for specific residues of PKA-C in complex with ATPγN (orange), ATPγN/RKIP (purple), and ATPγN/PKI (green).

