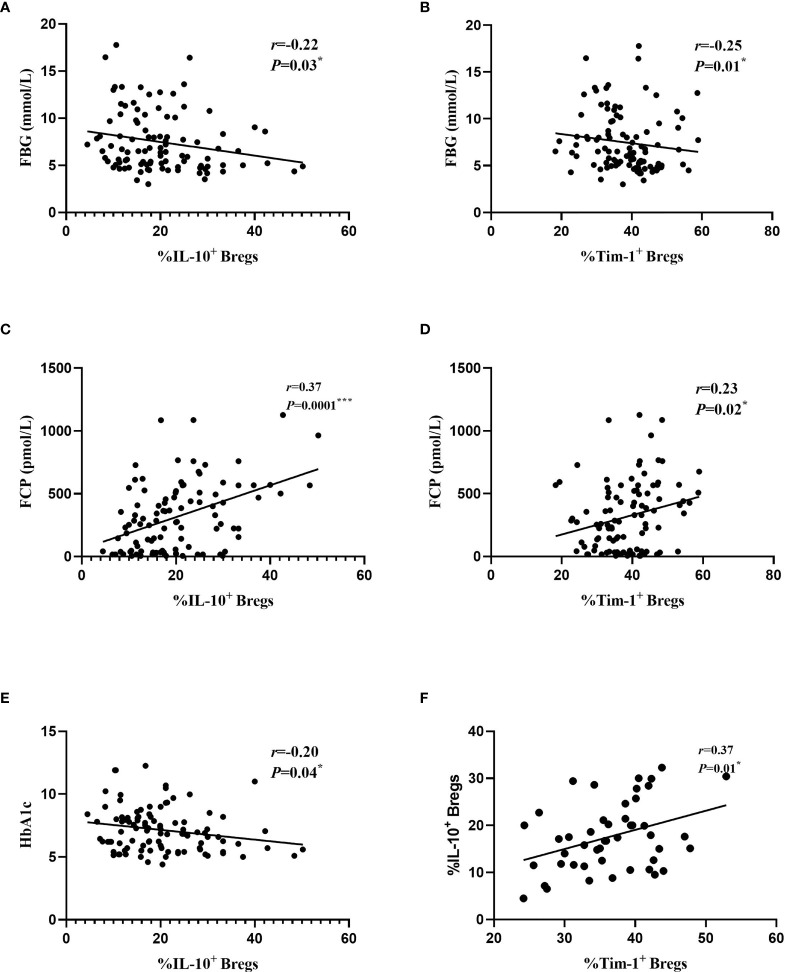
Figure 4.
Relationships between different B cell subsets and clinical data from all the study subjects. (A) Correlations between IL-10+ Bregs and FBG. (B) Correlations between Tim-1+ Bregs and FBG. (C) Correlations between IL-10+ Bregs and FCP. (D) Correlations between Tim-1+ Bregs and FCP. (E) Correlations between IL-10+ Bregs and HbA1c. (F) Correlations between IL-10+ Bregs and Tim-1+ Bregs in T1D. Each point represents an individual patient with T1D, T2D and healthy controls. * P < 0.05. *** P < 0.001.

