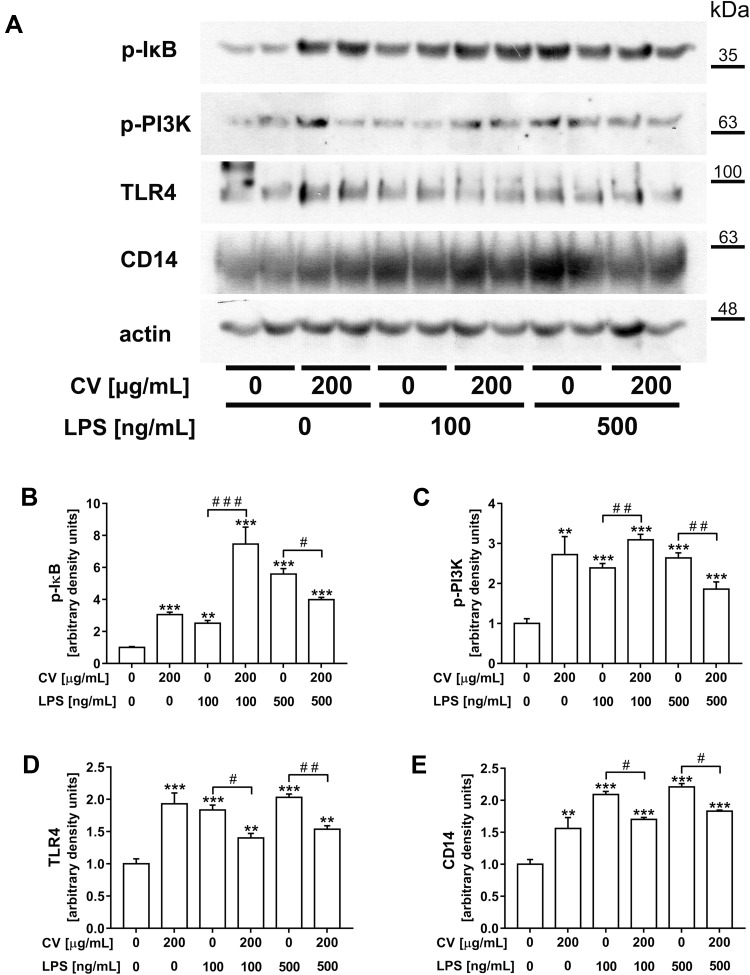
Figure 4.
Representative Western blot images of p-IκB, p-PI3K, TLR4 and CD14 in RAW 264.7 cells co-stimulated with CV extract and LPS (A). The cells were stimulated only with CV extract (200 µg/mL) or LPS itself (100 or 500 ng/mL) or co-treated with CV extract and LPS for 1 h. Relative densitometric bar graphs showing the levels of p-IκB (B), p-PI3K (C), TLR4 (D) and CD14 (E) in the cell lysates were analysed by immunoblotting relative to the actin content. The blots were quantified by densitometry using the ImageJ software; results are expressed as a fold-change compared to unstimulated control cells. Data are shown as the mean ± SEM of three independent experiments with two repetition in each experiment. Asterisks indicate significant differences between stimulated and untreated cells (**p < 0.01; ***p < 0.001). Hash marks indicate a significant difference between the cells stimulated with the respective dose of LPS alone and the cells co-treated with LPS and CV extract (#p < 0.05; ##p < 0.05; ###p < 0.05).

