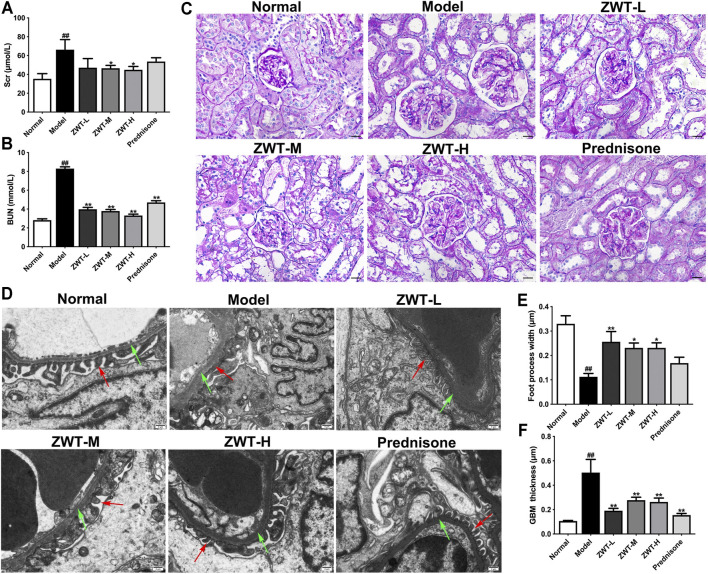
FIGURE 2.
ZWT protected renal function and structural changes in chronic glomerulonephritis (CGN) model rats. (A,B) The levels of blood urea nitrogen (BUN) and serum creatinine (Scr). (C) Representative images of PAS-stained renal sections (×400 magnification; scale bar = 20 μm). (D) Representative images of renal tissue ultrastructure by transmission electron microscopy (×5,000 magnification; scale bar = 5 μm). Red arrows indicate foot process. Green arrows indicate glomerular basement membrane (GBM). (E,F) Quantitative analysis of foot process width and GBM thickness. Data are represented as mean ± SD (n = 8). ## p < 0.01 versus normal group, *p < 0.05 and **p < 0.01 versus model group. ZWT ameliorated mitochondrial dysfunction in CGN model rats.

