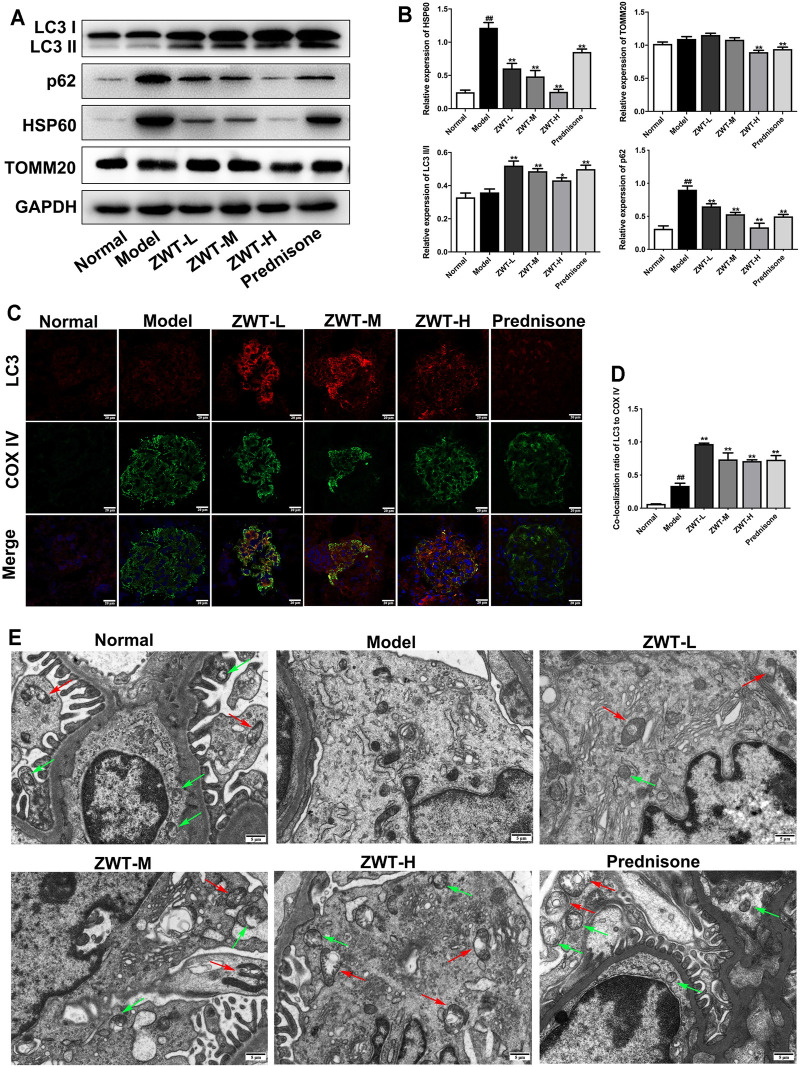
FIGURE 4.
ZWT induced mitophagy in CGN model rats. (A, B) The protein blots and quantitative analysis of LC3 II/I, p62, heat shock protein 60 (HSP60), and translocase of outer mitochondrial membrane 20 (TOMM20). The obtained values of HSP60, TOMM20, and p62 were normalized to GAPDH; LC3 II values were normalized to LC3 I. (C, D) The representative images and quantitative analysis of LC3 and COX IV colocalization (×400 magnification; scale bar = 20 μm). (E) Representative images of mitochondrial autophagosomes by Transmission electron microscopy (×5,000 magnification; scale bar = 5 μm). Red arrows indicated mitochondrial autophagosome. Green arrows indicate autophagosome. Data are represented as mean ± SD (n = 3). ## p < 0.01 versus normal group, *p < 0.05 and **p < 0.01 versus model group. ZWT alleviated mitochondrial dysfunction in podocytes.

