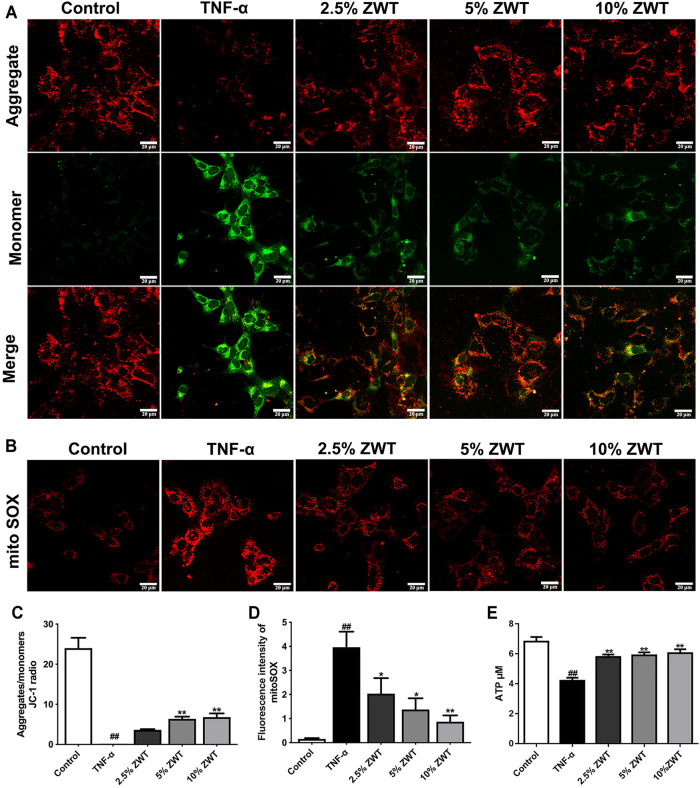
FIGURE 5.
ZWT alleviated mitochondrial dysfunction in podocyte. (A) Representative images of mitochondrial membrane potential in podocytes (×400, scale bar = 20 μm). (B) Representative images of mitoSOX in podocytes (×400, scale bar = 20 μm). (C) The ratio of aggregates/monomers of JC-1 probe. (D, E) The fluorescence intensity of mitoSOX, ATP levels in podocytes. Data are expressed as mean ± SD, n = 3. # p < 0.05, ## p < 0.01 versus control group, *p < 0.05 and **p < 0.01 versus TNF-α group. ZWT promoted mitophagy in podocytes.

