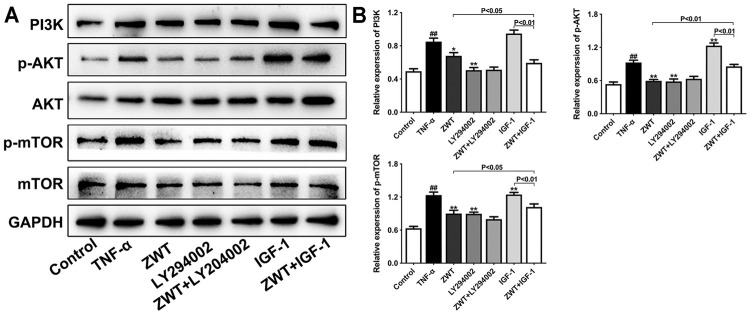
FIGURE 8.
The intervention of PI3K inhibitor and agonist against ZWT. (A,B) The protein blots and quantitative analysis of PI3K, p-AKT, and p-mTOR. The obtained values of PI3K were normalized to GAPDH; p-AKT values were normalized to AKT. p-mTOR values were normalized to mTOR. Data are represented as mean ± SD (n = 3). # p < 0.05, ## p < 0.01 versus control group, *p < 0.05 and **p < 0.01 versus the TNF-α group.

