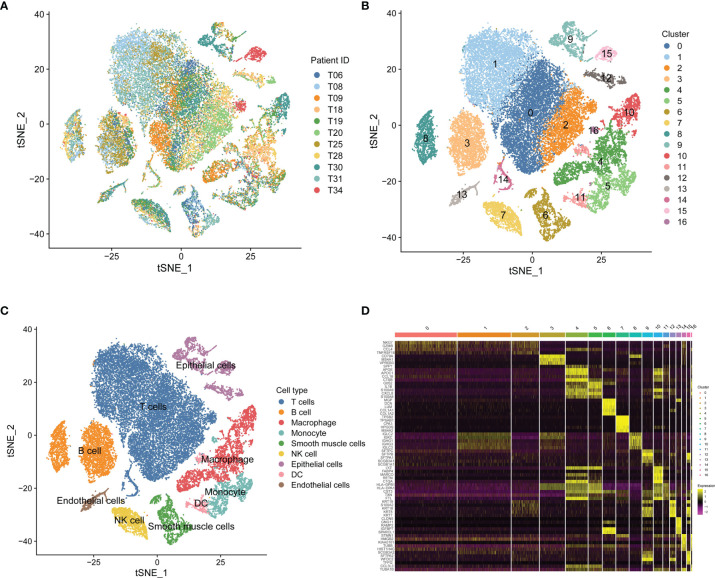
Figure 1.
Single-cell RNA-sequencing analysis identifies NK cell marker genes. (A) t-SNE plot of 45,149 cells from 11 primary LUAD samples. (B) t-SNE plot colored by various cell clusters. (C) The cell types identified by marker genes. (D) Heatmap showing the top 5 marker genes in each cell cluster.

