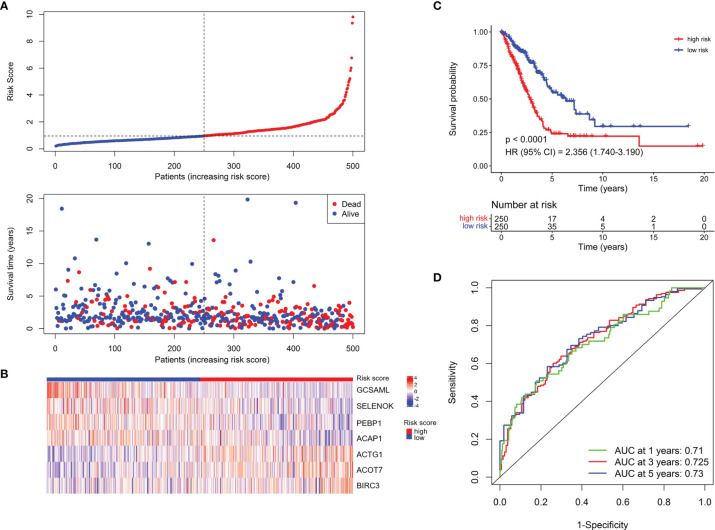
Figure 2.
Establishment of the NKCMGS in the TCGA LUAD cohort. (A) The distribution of risk score and survival status. (B) Heatmap showed the expression characteristics of the identified 7 NK cell marker genes. (C) Kaplan–Meier curves of survival analysis compared the overall survival of LUAD patients between high-risk and low-risk groups. (D) ROC curves of the NKCMGS for predicting the risk of death at 1, 3, and 5 years.

