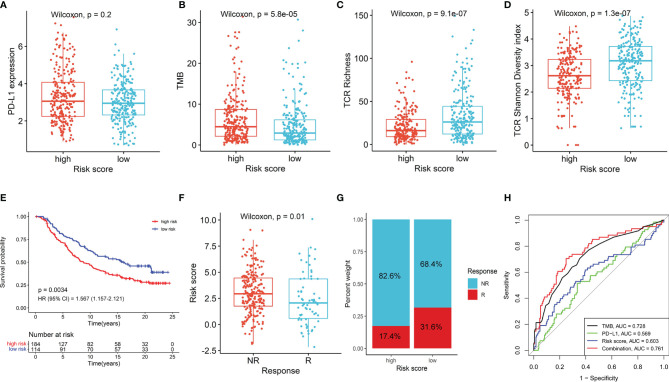
Figure 5.
The role of NKCMGS in predicting immunotherapeutic benefit. The comparison of PD-L1 expression (A), tumor mutation burden (TMB) (B), TCR richness (C), TCR diversity (D) between high-risk and the low-risk patients. (E) Kaplan–Meier curves for patients with high-risk and low-risk scores in the IMvigor210 cohort. (F) The comparison of risk scores in groups with different anti-PD-L1 treatment response status in the IMvigor210 cohort. NR represents progressive disease (PD)/stable disease (SD); R represents complete response (CR)/partial response (PR). (G) Treatment response rates of anti-PD-L1 immunotherapy in high- and low-risk groups in the IMvigor210 cohort (P = 0.005). NR represents SD/PD; R represents CR/PR. (H) ROC curves evaluating the predictive accuracy of the TMB, PD-L1, risk score, and combination of TMB, PD-L1, and risk score in the IMvigor210 cohort.

