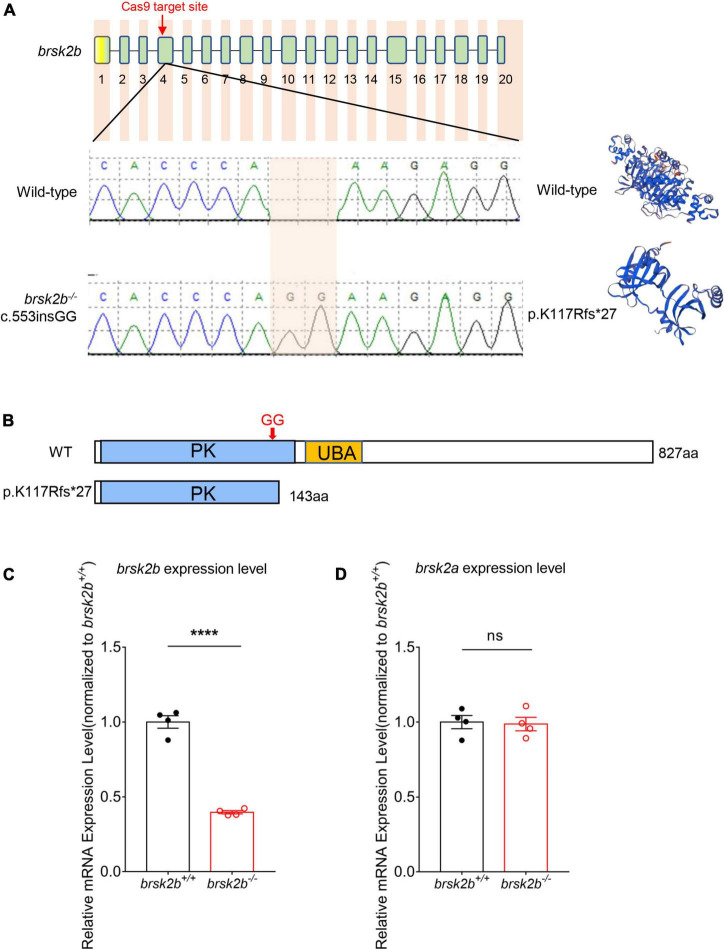
FIGURE 2.
Generation of brsk2b mutant zebrafish. (A) Sanger sequencing and computational modeling of wild-type and mutant brsk2b in zebrafish. (B) The protein structures of brsk2b before and after variation by CRISPR/Cas9. (C) RT-qPCR showed a decrease in brsk2b mRNA expression in brsk2b mutant zebrafish (n = 4 for each genotype, p < 0.0001). (D) RT-qPCR showed no significant difference in brsk2a mRNA expression level between wild-type and brsk2b mutant zebrafish (n = 4 for each genotype, p = 0.847). Groups were statistically compared using an unpaired Student’s t-test. Data are shown as mean ± SEM, ****p < 0.001.

