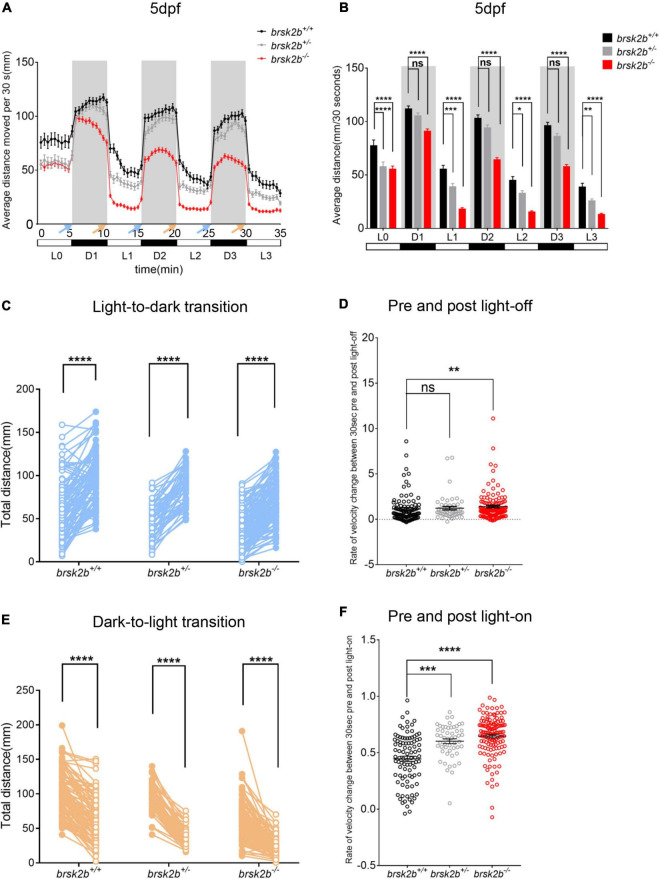
FIGURE 4.
The light/dark test of brsk2b+/+, brsk2b± and brsk2b–/– larvae at 5 dpf. (A,B) The activity of brsk2b–/– larvae was significantly reduced in both light and dark phases compared to brsk2b± and brsk2b+/+ fish. The activity was analyzed for the latter 5 min of light period (L0) and three 5-min of dark/light cycles (D1, L1, D2, L2, D3, L3). Blue arrows indicate light-to-dark transition and orange arrows indicate dark-to-light transition (brsk2b+/+: brsk2b±: brsk2b–/– = 89: 52: 128). Data are presented as mean ± SEM. Within groups were compared using one-way ANOVA and Dunnett’s multiple comparisons tests. (C) Paired dot plots compared average swimming distances per larva of the three light conversions in the 30 s before and after the three light-to-dark conversions (brsk2b+/+: brsk2b±: brsk2b–/– = 89: 52: 128). Within genotype comparisons were conducted by paired t-tests. (D) Box plots compared average rate of velocity change in the 30 s before and after the lights-off. Boxes denote the median, 1st and 3rd quartile, while whiskers represent the minimum and maximum values. Groups were statistically compared using Kruskal–Wallis ANOVA. (E) Paired dot plots compared average swimming distances per larva of the three light conversions in the 30 s before and after the three dark-to-light conversions (brsk2b+/+: brsk2b±: brsk2b–/– = 89: 52: 128). Within genotype comparisons were conducted by paired t-tests. (F) Box plots compared average rate of velocity change in the 30 s before and after the lights-on. Boxes denote the median, 1st and 3rd quartile, while whiskers represent the minimum and maximum values. Groups were statistically compared using Kruskal–Wallis ANOVA. *p < 0.05, **p < 0.01, ***p < 0.001, ****p < 0.0001.

