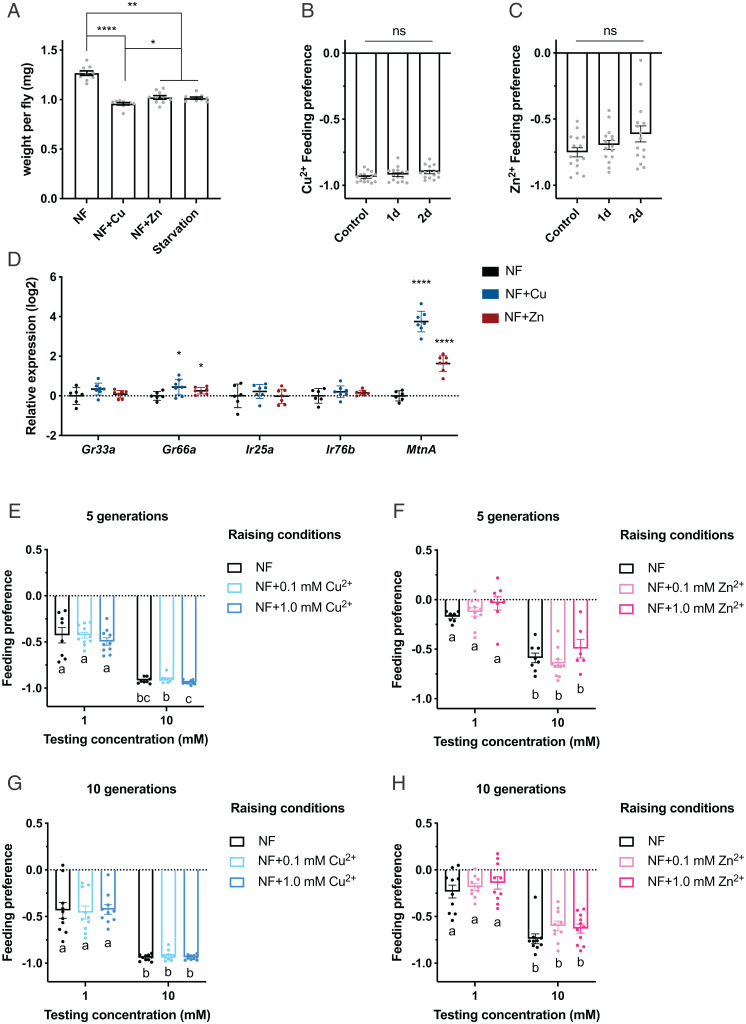
Fig. 7.
Taste preferences to copper and zinc ions after short- or long-term exposure. (A) Weight per female fly after short exposure to copper or zinc or starvation. NF denotes normal food. n = 10. *P < 0.05, **P < 0.01, ****P < 0.0001, Kruskal–Wallis test followed by uncorrected Dunn’s test. (B and C) Feeding preferences to 10 mM CuSO4 (B) or 10 mM ZnSO4 (C) following 1-d or 2-d exposure to 10-mM concentrations of the corresponding metal ions. n = 15. Mann–Whitney U test. (D) Relative messenger RNA levels of Gr33a, Gr66a, Ir25a, Ir76b, and MtnA in fly heads upon exposure to 10 mM CuSO4 or ZnSO4 for 1 d. n = 6 or 7. Asterisks indicate significant differences from NF control (*P < 0.05, ****P < 0.0001), Welch’s t test. (E–H) Feeding preferences to copper or zinc after 5 or 10 generations raised on media as indicated. n values are 8 to 11 (E), 6 to 10 (F), 10 (G), and 10 or 11 (H). Groups with different preferences are marked with different letters (a, b, c). Kruskal–Wallis test followed by uncorrected Dunn’s test. Error bars are SEM. ns, not significant.

