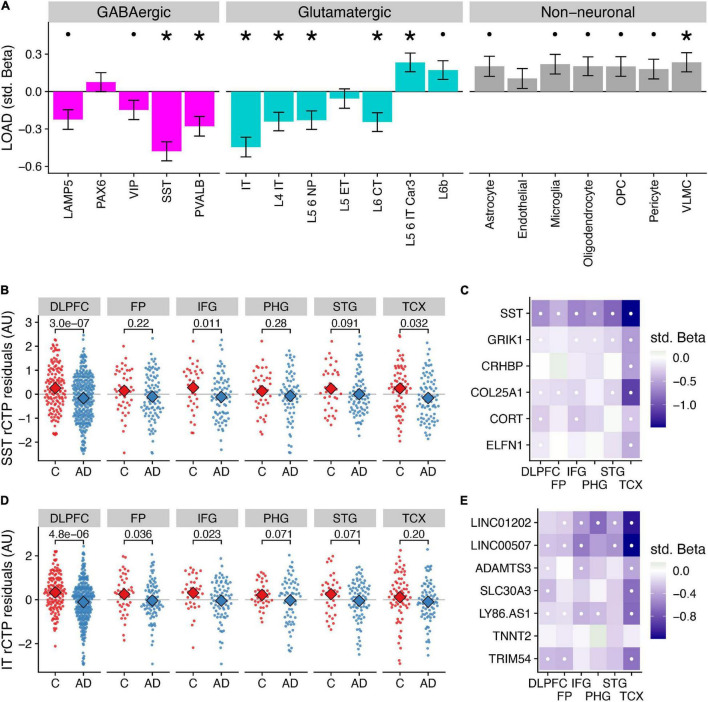
FIGURE 1.
Differences in relative cell type proportions of neuronal and non-neuronal subclasses in Alzheimer’s disease. (A) Consensus associations of Alzheimer’s disease (“AD”) vs. control (“C”) status and cell type-specific relative cell type proportions (rCTPs) across six bulk RNAseq datasets. Y-axis shows standardized beta coefficients estimated using a mixed effects model to pool associations across datasets. Positive (negative) standardized beta coefficients indicate an increase (decrease) in the cell type-specific rCTP in AD. Error bars indicate one standard deviation. Asterisks (dots) above each cell type indicate two-sided pbonf < 0.05 (or less stringent FDR < 0.1). (B) Comparisons between rCTPs between controls and AD cases in each of the six bulk gene expression datasets, ROS/MAP, sampling the dorsolateral prefrontal cortex (DLPFC), MSSB, sampling the Frontal Pole (FP), Inferior Frontal Gyrus (IFG), Parahippocampal Gyrus (PHG), and Superior Temporal Gyrus (STG), and the Mayo cohort, sampling the Temporal Cortex (TCX). Y-axis shows estimates of rCTPs for somatostatin (SST) interneurons from individual post-mortem samples (each dot reflects one individual), after covarying for age and sex. Numbers show p-values from a statistical model comparing residualized rCTPs between controls and AD cases, uncorrected for multiple comparisons across datasets and cell types. Subjects with outlier values of rCTPs not shown. (C) Heatmaps showing AD case/control associations for marker genes for SST inhibitory cells. White dots indicate specific associations where FDR < 0.1. (D,E) Same as panels (B,C) for intra-telencephalic-projecting (IT) excitatory pyramidal cells (IT cells).

