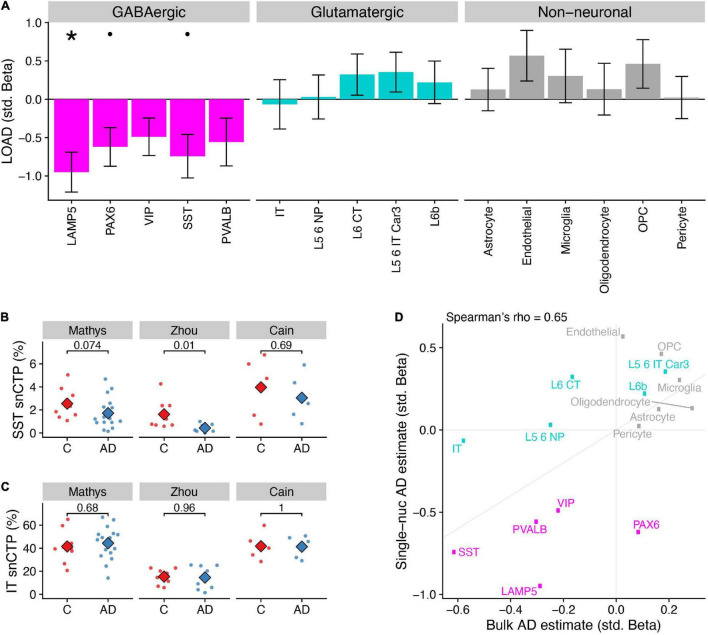
FIGURE 2.
Differences in single-nucleus derived cell type proportions (snCTPs) of neuronal and non-neuronal subclasses in Alzheimer’s disease. (A) Consensus associations of AD status and snCTPs across three AD snRNAseq case/control datasets. Y-axis shows standardized beta coefficients estimated using a mixed effects model to pool associations across datasets. Positive (negative) standardized beta coefficients indicate an increase (decrease) in the cell type-specific snCTP in AD. Error bars indicate one standard deviation. Asterisks (dots) above each cell type indicate two-sided pbonf < 0.05 (or less stringent FDR < 0.1). (B) Comparisons between snCTPs between controls and AD cases in each of three snRNAseq datasets. Y-axis dots show snCTPs for somatostatin (SST) interneurons (as a percentage of all nuclei sampled) from individual post-mortem samples. Numbers show p-values from t-test (uncorrected for multiple comparisons across datasets and cell types) from a statistical model comparing snCTPs between controls and AD cases. Subjects with outlier values of rCTPs not shown. (C) Same as panel (B) for intratelencephalic-projecting (IT) excitatory pyramidal cells. (D) Consistency of AD standardized effect sizes between bulk rCTPs and snCTPs based on single-nucleus analyses. X-axis shows point estimates of standardized beta coefficients of AD effects on rCTPs in the ROS/MAP cohort (as in Figure 1A) and y-axis is the same as point estimates shown in A. Diagonal line denotes the unity line. Inset correlation value denotes overall Spearman correlation (rho) between rCTP and snCTP estimated effects.

