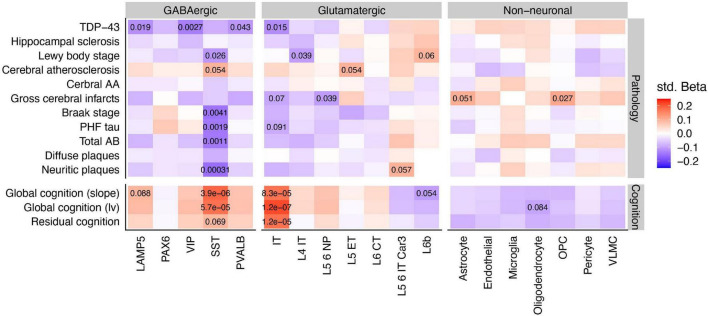
FIGURE 3.
Associations between cell type specific relative proportions and neuropathologies, cognition, and residual cognition. Inset values denote the FDR statistics of specific associations, where FDR < 0.1. Note that while pathology scores are coded such that greater levels of pathology indicate worsening brain health, global cognition scores are coded such that higher scores indicate better cognition and less dementia. Std Beta, standardized beta coefficients; PHF, paired helical filaments; AA, amyloid angiopathy.

