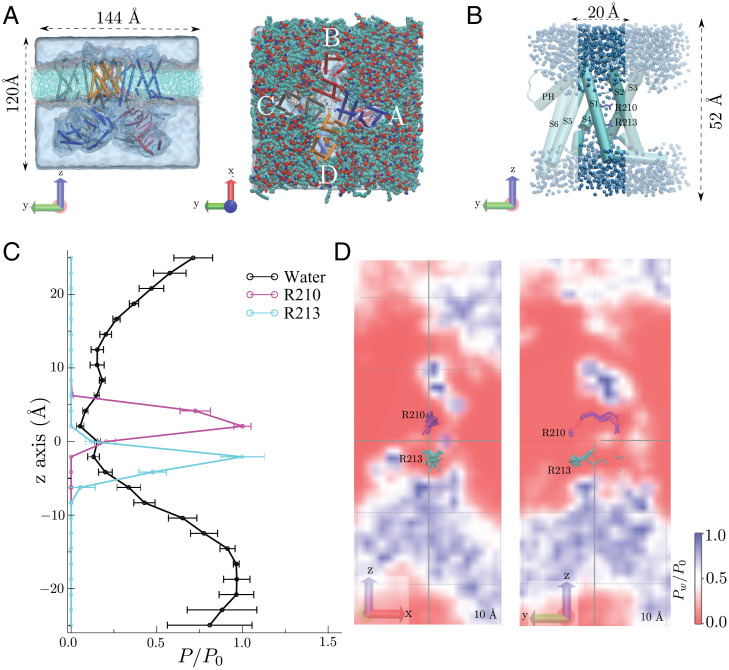
Fig. 2.
Molecular simulations shows a VSD dry zone around the BK channel gating charges. (A) Side (Left) and top (Right) views of the simulated system, where the h-BK channel (PDB ID: 6V35), lipids, and water are presented in cartoon, transparent surface, and cyan representations, respectively. (B) Representative snapshot of VSD monomer. Unshaded regions depict the region employed for density calculations shown in C. (C) Relative densities of water, R210, and R213 within a 10-Å radius cylinder along z −25 Å < z < 25 Å. Error bars represent the time average over the four chains. (D) Water density profile in a plane crossing the R210-R213 pair (shown in magenta and cyan licorice representation, respectively) and centered at the origin.

