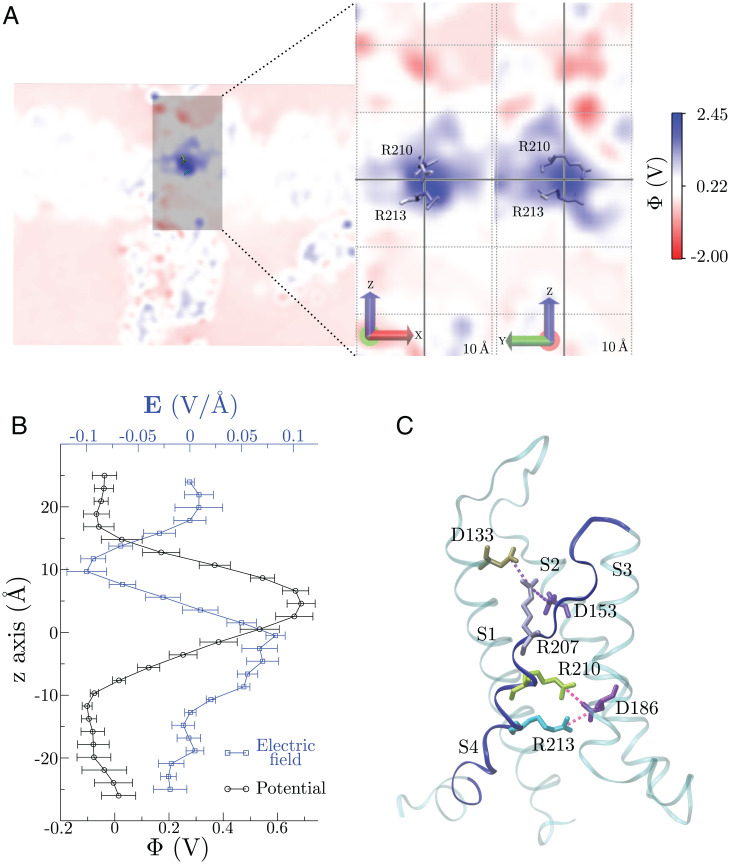
Fig. 4.
The membrane electric field is focused on the VSD dry zone. (A) VSD electrostatic potential profiles (Φ) in the R210-R213 plane (Left). A closer view of Φ shows the membrane electric field is highly focused on the gating charges populating the VSD dry zone. (B) Average Φ (over time and for the four monomers) and electric field along the z axis; Φ was computed within a 10-Å radius cylinder along z −25 Å < z < 25 Å. (C) VSD salt bridges observed during the 0.5-µs simulation. Top: average distances over time and for the four monomers between arginines and aspartates. Bottom: graphical depiction of each salt bridge with the VSD represented as cyan transparent cartoon. Error bars represent the SD of the time average for the four monomers.

