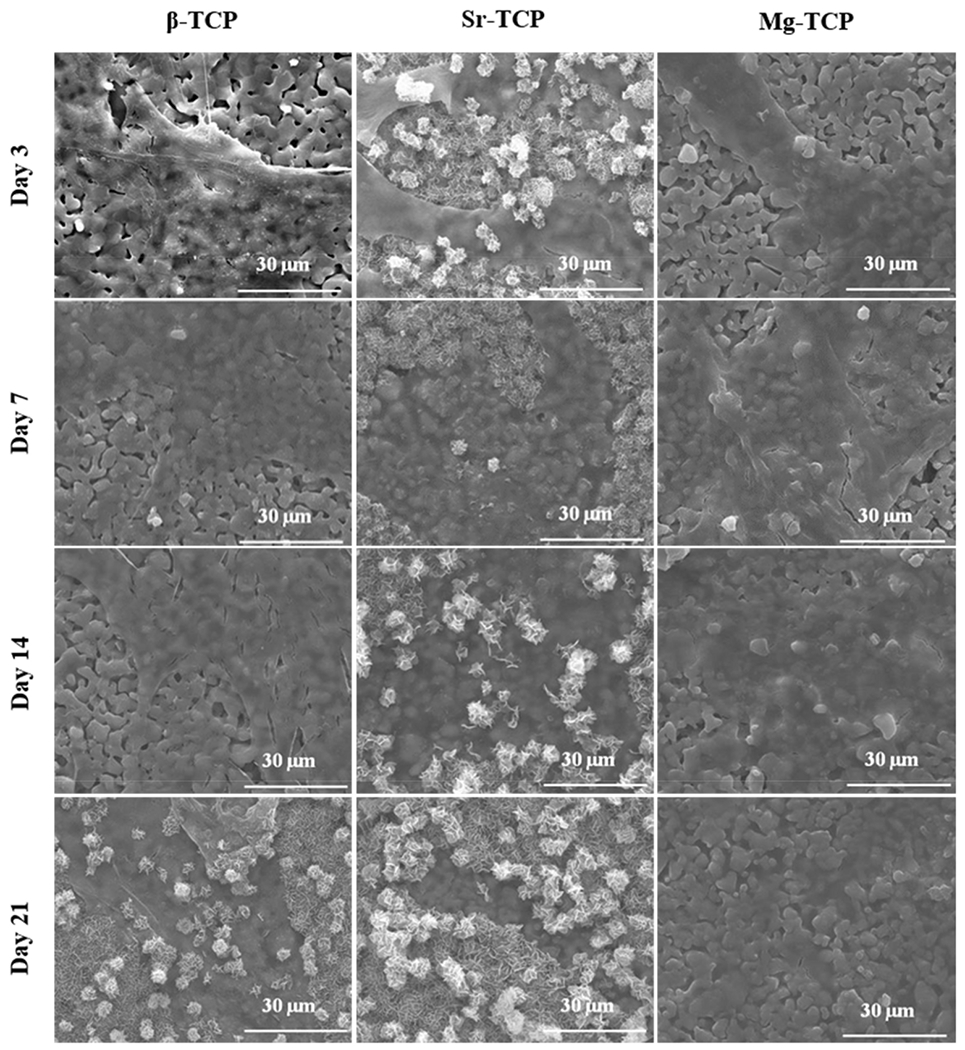
Figure 3.

SEM images of sample surfaces after 3, 7, 14, and 21 days of culture. Cellular morphology on samples after 3, 7, 14, and 21 days of culture exhibited greater flattening and spreading on Sr and Mg-TCP over control. Greater amounts of salt formation was present at all time points of Sr-TCP and day 21 of β-TCP.
