Figure 2.

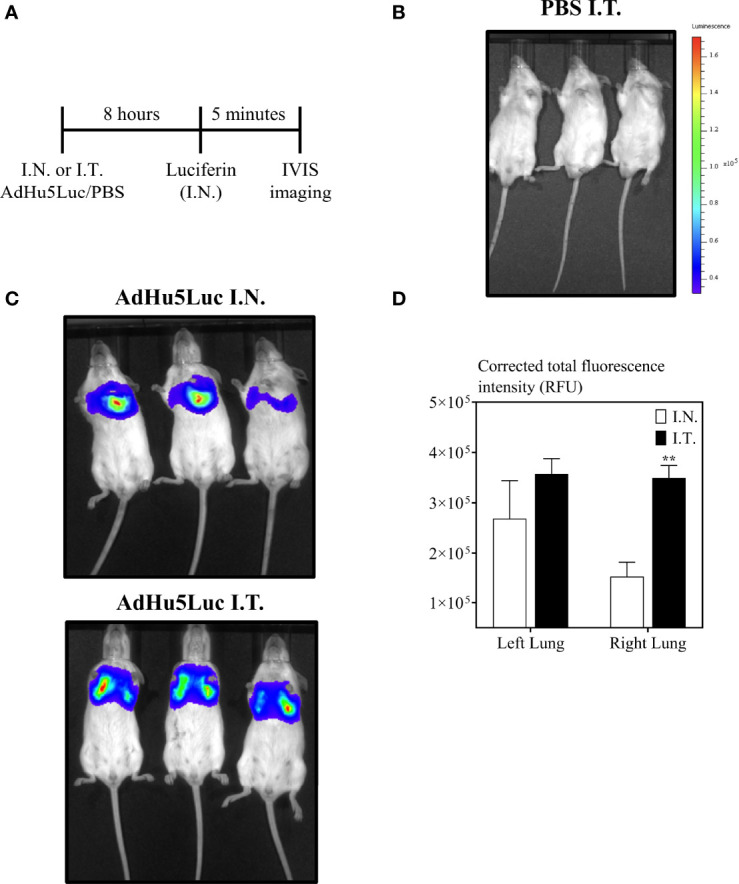
Biodistribution of vaccine surrogate in the lung following intranasal or endotracheal inoculation. (A) Experimental schema. Mice were inoculated intranasally (I.N.) or endotracheally (I.T) with adenovirus-vector expressing luciferase (AdHu5Luc) or PBS. Biodistribution was visualized as a factor of light emission upon intranasal administration of luciferin. Images were obtained using an IVIS Spectrum and presented as pseudocolour images of bioluminescence in PBS (B) or AdHu5Luc inoculated animals (C). Red represents the most intense areas of biodistribution while the blue corresponds to the weakest areas of biodistribution. Mice were imaged with an integration time of 30 sec. Three mice per treatment group is shown. (D) Bar graph shows corrected total fluorescence intensity measured in relative fluorescence units (RFU) and quantified using ImageJ in either right or left lung. Data is from 3 mice/group and RFU are presented as mean ± SEM. **p < 0.01.
