Figure 3.
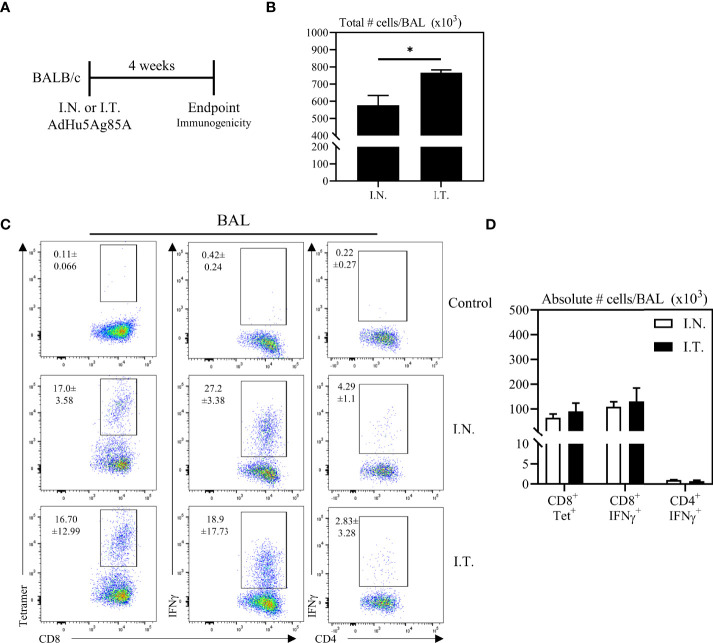
Vaccine-specific T cell responses in the airways following endotracheal immunization compared to intranasal immunization. Experimental schema (A). Mice immunized intranasally (I.N.) or endotracheally (I.T.) with AdHu5Ag85A were scarified 4 weeks post-immunization and mononuclear cells from airways were examined for vaccine-specific responses. (B) Bar graphs comparing total number of mononuclear cells in bronchoalveolar lavage (BAL) fluid. (C) Representative flow cytometric dotplots showing frequencies of Ag85A-specific CD8 T cells (CD8+tet+) determined by tetramer staining, and frequencies of IFNγ+ CD8+ and CD4+ T cells determined by intracellular cytokine staining of cells stimulated with Ag85A CD8 or CD4 T-cell specific peptides in BAL. Top row dotplots (Control) show the defining gates for tetramer population gated out of total CD8 T cells from unimmunized animal and the gates for CD8+IFNγ+ and CD4+IFNγ+ T cells out of total unstimulated CD8 and CD4 T cells from BAL of immunized mice. Numerical indicated in the dotplots represent the mean frequency of parent (CD4 or CD8 T cells) ± SEM. (D) Bar graphs comparing absolute number of CD8+tet+, CD8+IFNγ+, and CD4+IFNγ+ T cells in BAL of intranasal- and endotracheal-immunized mice. Absolute numbers of CD8+tetramer+, CD8+ IFN-γ+ and CD4+ IFN-γ+ shown in bar graphs were calculated based on frequency of CD3+live cells gated out of total events to exclude all non-immune cells. Data is from 3 mice/group, representative of two independent experiments and presented as mean ± SEM.*p < 0.05.

