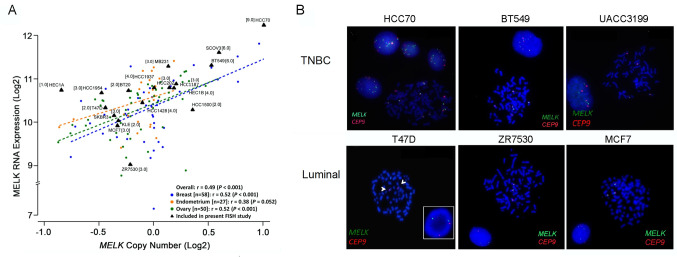
Fig 4. Correlation of MELK mRNA expression with copy numbers in breast cancer cell lines.
(A) MELK RNA expression moderately correlates with MELK DNA CN in breast (r = 0.52, p<0.001), endometrial (r = 0.38, p<0.001), and ovarian cancer (r = 0.52, p<0.001) cell lines from the CCLE cohort (n = 135). The X-axis represents CN and the Y-axis represents RNA transcripts. P-values were calculated using the Pearson correlation test. Labeled black triangles mark 18 cell lines analyzed by MELK/CEP9 FISH in present study. Brackets are the absolute mean MELK copies/cell. (B) FISH images of six representative cell lines (three TNBC and three luminal cell lines) with MELK gain and loss are given for comparison. MELK is localized by the green fluorescent signal and the CEP9 is localized by the red fluorescent signal. The cells were counterstained with DAPI (blue). The arrowhead indicates a structural alteration. Detailed FISH results are summarized in Table 1.

