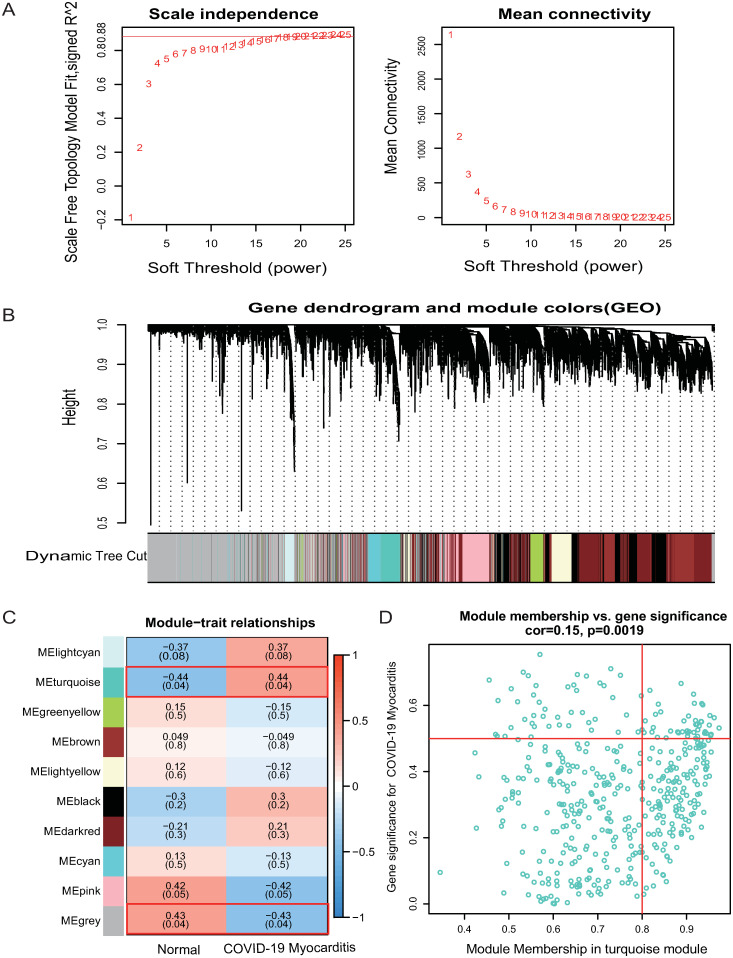
Fig 3. Identification of significant modules and genes of GSE167028 by WGCNA.
(A) Network topology analysis with different soft thresholds. The scale-free R^2 was 0.88 and the soft threshold was 20. (B) A cluster dendrogram of module-specific colors showed 10 co-expressed gene modules, each containing more than 80 genes. (C) Correlation between disease groupings and gene modules. (D) The scatter plot of Gene significance vs Module membership in the turquoise co-expression module.

