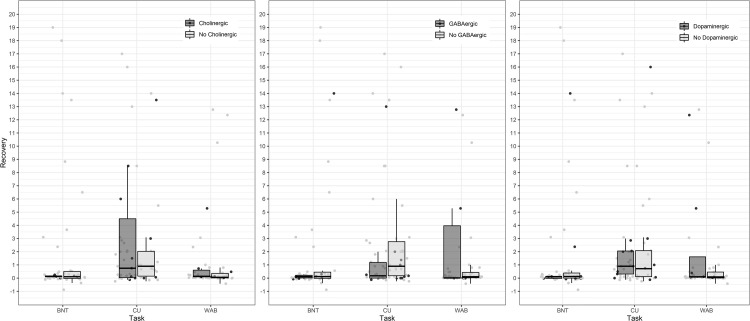
Fig 1. Change in performance by group.
Scores in the table reflect standardized difference scores between acute performance and average chronic performance. In each case, the drug group is represented by the darker grey, while the no drug group is represented in lighter grey. Data points are jittered slightly on the x-axis to increase visibility of overlapping scores (within task x-axis differences are not meaningful). The outlier patient previously described with an improvement in WAB AQ of 51.5 was not included in the figure.

