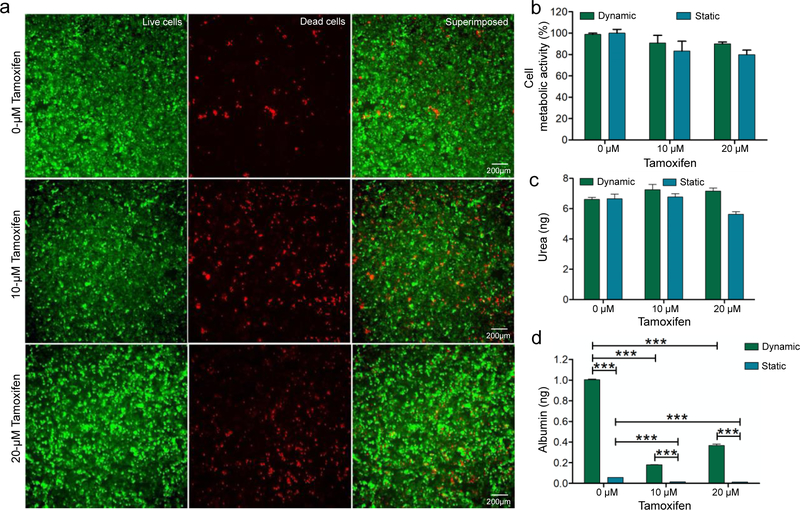
Figure 5.
(a) Cytotoxicity of tamoxifen on HepG2 cells shown via cell viability assay using Calcein AM (green) and EthD-1 (red) staining after 48 h of tamoxifen treatment; (b) quantified cell metabolic activity of HepG2 cells at different concentrations of tamoxifen; (c) quantified 48-h urea production by HepG2 cells at different concentrations of tamoxifen; and (d) quantified 48-h albumin production by HepG2 cells at different concentrations of tamoxifen. Asterisk represents a significant difference between the dynamic culture group and the static culture group using two-way ANOVA (p≤0.05).

