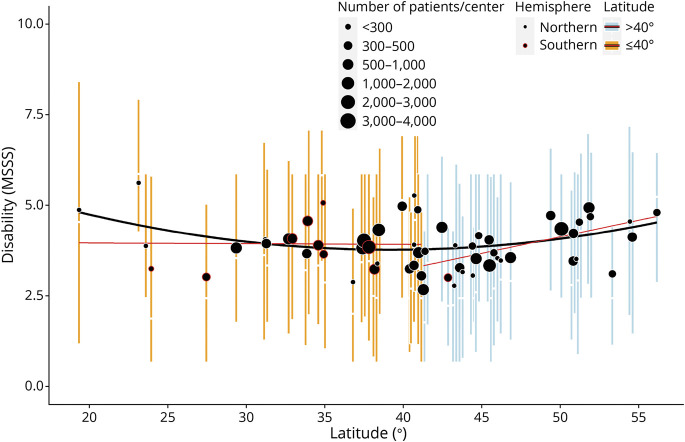
Figure 1. Association Between Latitude and Multiple Sclerosis Severity.
Mean Multiple Sclerosis Severity Scores (MSSS) plotted by the latitude of each MSBase center are shown. Number of patients per center is indicated by circle size. Color of circle margin denotes location of centers in Northern/Southern Hemisphere. Interpolated curve represent the overall quadratic model (black) and 2 linear models split by 40° latitude (red).

