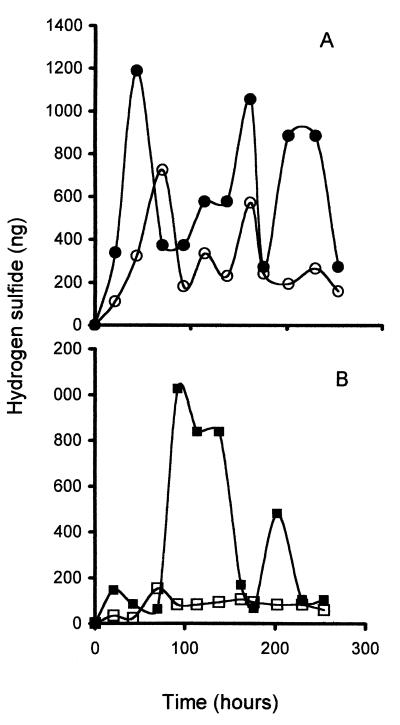
FIG. 1.
Pattern of production of H2S in UCD522 (A) and UCD713 (B) at two concentrations of nitrogen. The levels of H2S represent the total amount accumulated in the cadmium trap for that interval. For example, the point at 43 h represents the amount accumulated between 21 and 43 h. Open symbols, high nitrogen; solid symbols, low nitrogen.

