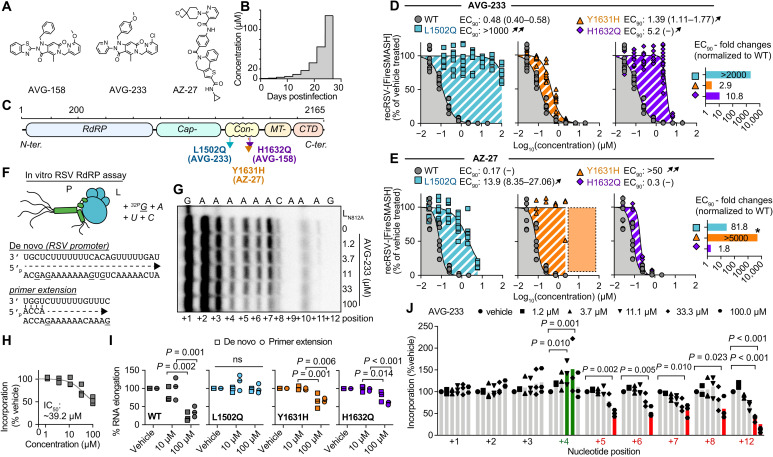
Fig. 1. Resistance and mechanistic profiling of AVG-233.
(A) Chemical structure of AVG-158, AVG-233, and AZ-27. (B) Schematic of the escalating-dose viral adaptation of recRSV-mKate with AVG-158 or AVG-233. (C) Schematics of RSV L with candidate resistance sites for AVG-233 and AVG-158 and a reported resistance site to polymerase inhibitor AZ-27. (D and E) Dose-response inhibition of AVG-233 (D) and AZ-27 (E) against recRSV-mKate harboring L1502Q, Y1631H, or H1632Q substitution. Insets show EC90 fold changes relative to L wild type (WT). Highest AZ-27 concentration tested, 6 μM; dotted area and star based on reported values (23). (F to J) In vitro RSV RdRP assays using synthetic primer/template pairs (G to J) or promoter sequence (I). Representative autoradiogram (G) with densitometric analysis (H). (I) Relative in vitro RNA elongation in the presence of indicated doses of AVG-233 compared to vehicle treated, in the presence of L1502Q, Y1631H, or H1632Q substitution. (J) Densitometric quantitation of in vitro RNA elongation at each incorporated position in the presence of indicated concentration of AVG-233. In all panels, symbols represent independent biological repeats (n = 3), bars represent means, and lines represent four-parameter variable slope regression modeling. Two-way ANOVA with Dunnett’s post hoc tests (I and J).

