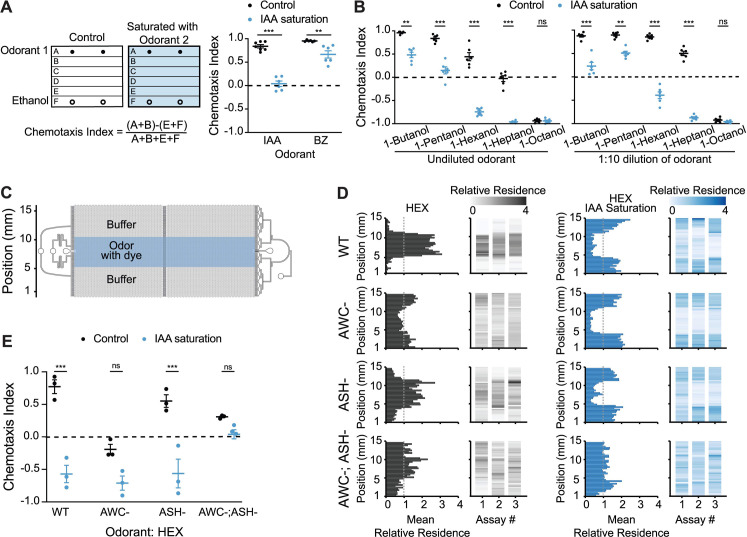
Fig 1. The AWC neurons drive attraction or avoidance of hexanol in the absence or presence of sIAA, respectively.
(A) (Left) Cartoon of plate chemotaxis assay (see Materials and methods). Filled and open circles: location of 1 μl each of the test odorant or ethanol. Positive and negative chemotaxis indices indicate attraction and avoidance, respectively. (Right) Behaviors of wild-type animals on control or sIAA plates. Test odorants: 1:200 dilution of BZ, 1:1,000 dilution of IAA. (B) Behaviors of wild-type animals on control and sIAA plates containing the indicated dilutions of different alcohols as the test odorants. (C) Schematic of the microfluidics behavioral device used in behavioral assays. Adapted from [42]. (D) Average histograms showing mean relative x-y residence (relative to spatial odor pattern) of animals of the indicated genotypes over 20 minutes in devices with a central stripe of 10−4 HEX without (left), or with, a uniform concentration of 10−4 IAA (right) in the device. Indicated neurons in each examined strain were genetically ablated via the expression of caspases (S1 Table). Mean relative residence >1 or <1 (dashed vertical line) indicate attraction and avoidance, respectively. Corresponding heat maps show the density of tracks in the y-position for each assay. n = 20–30 animals per assay; 3 biological replicates. (E) Chemotaxis indices calculated from behavioral assays shown in D. In A, B, each dot is the chemotaxis index of a single assay plate containing approximately 100–200 adult hermaphrodites. Assays were performed in duplicate over at least 3 days. In E, each dot is the chemotaxis index from a single assay in behavior chips. Long horizontal bars indicate the mean; errors are SEM. **, ***: P < 0.01 and 0.001, respectively (A, B: Kruskal–Wallis with post hoc pairwise Wilcoxon test and Benjamini–Hochberg method for P-value correction; E: 2-way ANOVA with Bonferroni’s correction); ns, not significant. Underlying data are provided in https://doi.org/10.5281/zenodo.6537728. BZ, benzaldehyde; HEX, hexanol; IAA, isoamyl alcohol; sIAA, saturating IAA.

