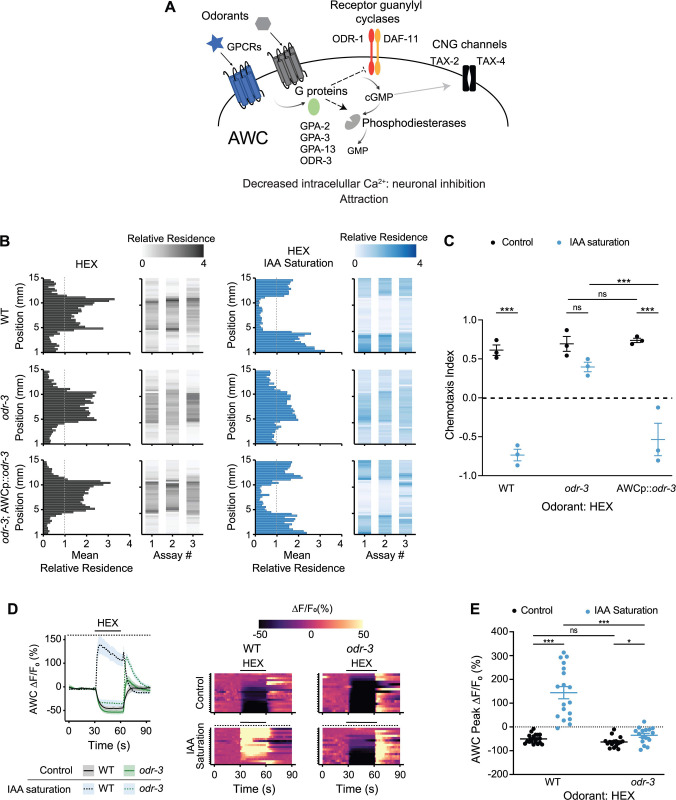
Fig 3. The ODR-3 Gα protein is required for hexanol-mediated activation of AWC in sIAA.
(A) Cartoon of the olfactory signal transduction pathway in AWC. Adapted from [61]. (B) Average residence histograms and heatmaps as described for Fig 1D. n = 20–30 animals per assay; 3 biological replicates. An odr-3 cDNA was expressed in AWC under the odr-1 promoter. The concentration of hexanol was 10−4. (C) Chemotaxis indices calculated from behavioral assays shown in B. Each dot is the chemotaxis index from a single assay in behavior chips. (D) (Left) Average changes in GCaMP3 fluorescence in AWC in response to a pulse of 10−4 hexanol in wild-type and odr-3(n2150) mutants. The presence of saturating chemicals in the imaging chip at 10−4 dilution is indicated by a dashed line. Shaded regions are SEM. (Right) Corresponding heatmaps of changes in fluorescence intensity; n ≥ 15 each. A subset of wild-type hexanol response data in control conditions were interleaved with data in Figs 2A and 2E and 4C and are repeated; wild-type hexanol response data in sIAA were interleaved with experimental data in Fig 4C and are repeated. Raw traces of hexanol-evoked responses in AWC in control and sIAA conditions are shown in S5C Fig. (E) Quantification of fluorescence intensity changes upon hexanol odorant onset under nonsaturated or saturated conditions from data shown in D. Each dot is the response from a single neuron. Long horizontal bars indicate the mean; errors are SEM. *, ***: P < 0.05 and 0.001, respectively (C: 2-way ANOVA with Bonferroni’s correction; E: Kruskal–Wallis with post hoc pairwise Wilcoxon test and Benjamini–Hochberg method for P-value correction); ns, not significant. Underlying data for this figure are provided in https://doi.org/10.5281/zenodo.6537728. HEX, hexanol; IAA, isoamyl alcohol; sIAA, saturating IAA.

