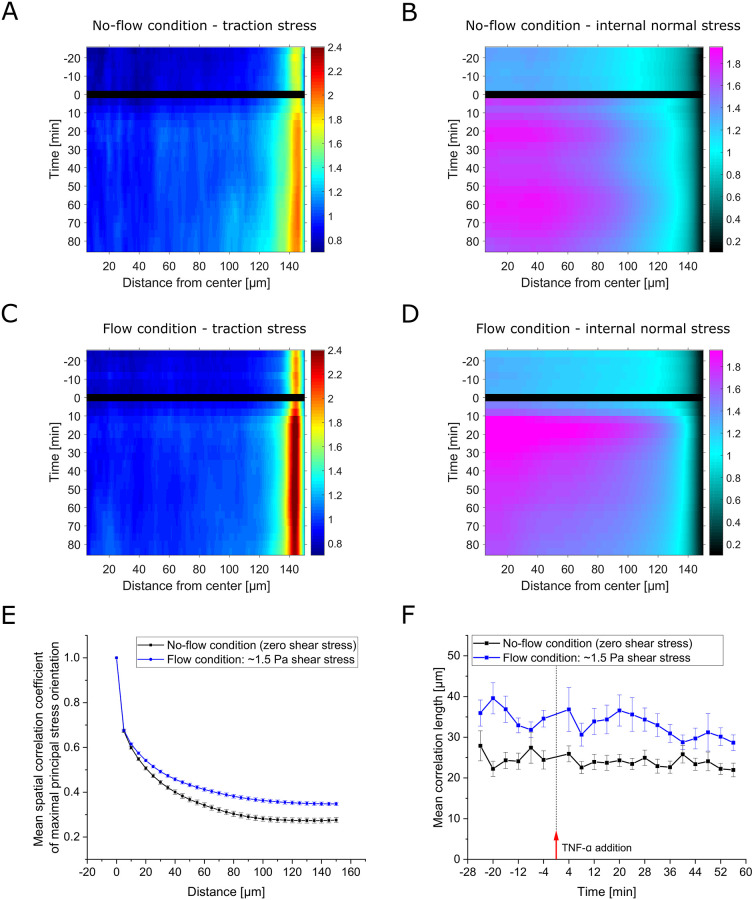
Fig 5. Spatial distribution and cooperativity of stress in response to TNF-α exposure under flow (1.5 Pa shear stress) and no-flow (zero shear stress) conditions.
A-D: Kymographs showing the development of radial profiles of (A,C) substrate traction and (B,D) internal normal stress over time under (A,B) no-flow (zero shear stress) conditions and (C,D) flow (1.5 Pa shear stress) conditions. Kymographs are based on the same measurements as data in Fig 4A and 4B. Colors encode the stress intensity normalized as in Fig 4A and 4B. As application of TNF-α required some time and caused disturbance, no image data was analyzed for the respective timepoint 0 (black line). The overall increase in stress intensity fits the time course of the average values shown in Fig 4A and 4B. While the rapid increase in traction stress is largely generated at the edge of the monolayer, a delayed increase of traction stress in the inner region can still be observed (see A,C). Interestingly, the discrepancy between edge and inner region of the monolayer for the exerted traction stress is significantly higher in the presence of flow (see also S2 Fig). The initial rise inflicted by the administration process is apparent throughout the inner region of the monolayer (see B). In agreement with the average values, this is fully absent in (D) the situation of unaltered external stress in the presence of fluid flow. The higher relative increase in the condition of fluid shear stress is observable throughout the whole inner region. However, the subsequent decay in this case, appears even more striking than expected from the average values. Conversely, in the situation of no flow, the internal normal stress in the inner region starts to oscillate. E: Mean spatial correlation coefficient of maximal principal normal stress orientation under flow (1.5 Pa shear stress) and no-flow (zero shear stress) conditions as a function of the distance between stress locations. The coefficient was calculated for and averaged over all time points and individual cellular islands from all 3 experiments, respectively for both conditions. The error shown is the SEM with respect to individual islands. The level of correlation of stress orientations is higher in the presence of fluid flow. F: Mean correlation length for individual time points in both conditions. The correlation length has been defined as the distance at a value of one half of the correlation coefficient of maximal principal normal stress orientations. No clear trend can be identified.

