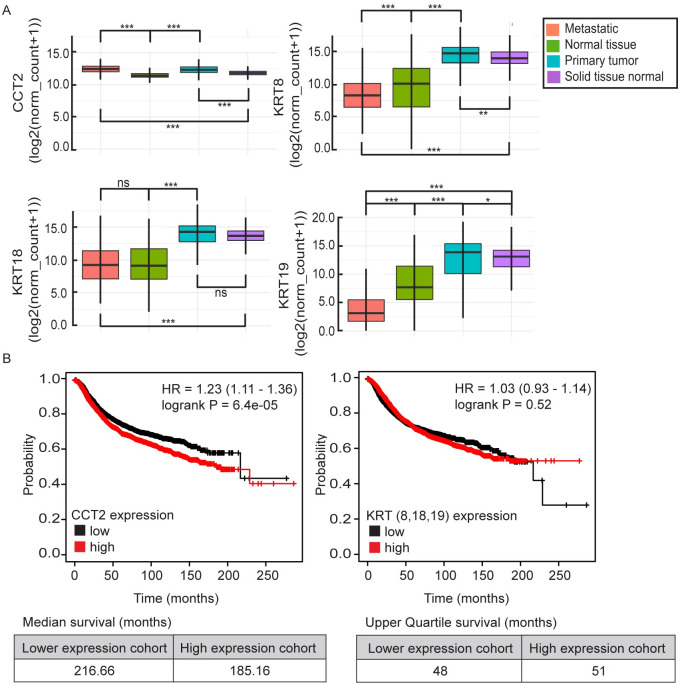
Fig 1. Bioinformatic and histological analysis of CCT2 in cancer patients.
(A) UCSC Xena analysis from “TCGA, TARGET, GTEx” dataset (n = 17,200) comparing mRNA expression of CCT2, KRT8, KRT18, and KRT19 in metastatic tissue (orange), normal tissues/GTEx (green), primary tumor (blue), and solid tissue normal/TCGA (purple). * = p<0.05, ** = p<0.005, *** = p<0.0001. (B) KMplotter analysis of overall survival (OS) with low vs. high CCT2 mRNA expression and low vs high mRNA expression of the mean of KRT8, KRT18, and KRT19 combined in breast cancer patients; n = 4,929. Hazard ratios (HR) and log-rank p-values, as calculated by kmplot.com software, are listed on the KmPlots.

