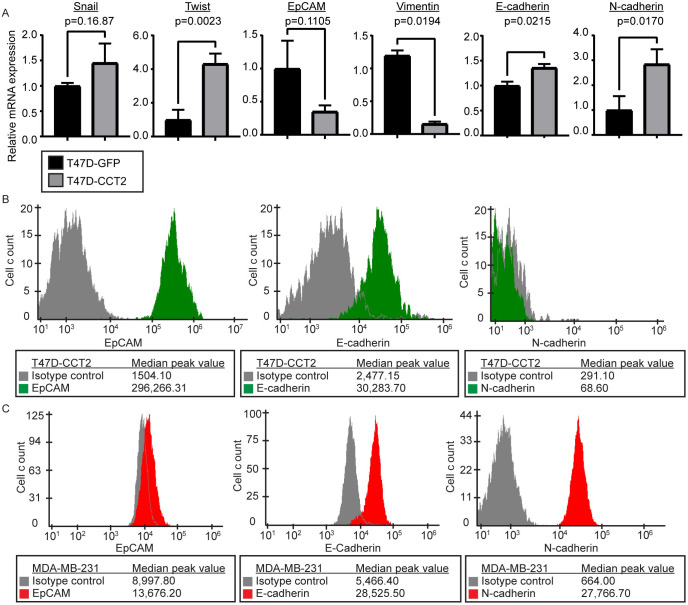
Fig 3. EpCAM, vimentin, E-cadherin, and N-cadherin expression in MDA-MB-231 and T47D cells.
(A) RT-PCR data comparing lentiviral control (T47D-GFP) (black) with T47D-CCT2 (grey) for expression of EMT genetic markers: SNAIL and TWIST, epithelial markers: EpCAM and E-cadherin, and mesenchymal markers: vimentin and N-cadherin. p-values are shown on the graph. (B) Flow cytometry data detecting surface expression of EpCAM, E-cadherin, and N-cadherin protein in T47D-CCT2 cells (green) compared to isotype controls (grey). (C) Flow cytometry data detecting surface expression of EpCAM, E-cadherin, and N-cadherin proteins in MDA-MB-231 cells (red) compared to isotype controls (grey). All experiments were performed in duplicate.

