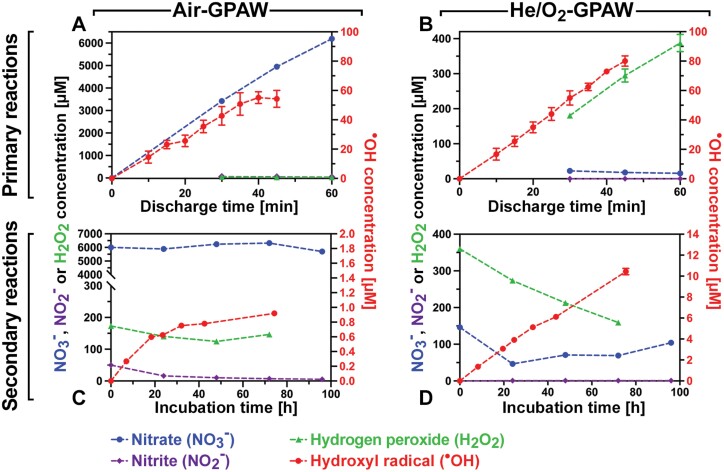
Fig. 2.
Chemical characterization of gas plasma-activated water (GPAW). (A) Air-GPAW. (B) He/O2-GPAW. Top panels: time evolution of the concentrations of major chemical species produced in GPAW during the discharge treatment in the plasma bubble reactor; primary reactions (Supplementary Fig. S1). Bottom panels: secondary chemical reactions after removal from the bubble reactor. Quantification of major chemical species as a function of the incubation time at ~22 °C after the plasma treatment. Note that Air-GPAW and He/O2-GPAW differ considerably in their composition; means ±SEM are presented.

