. 2022 Jun 23;11:e79552. doi: 10.7554/eLife.79552

Figure 1. with 8 supplements.

Overall structures of E. coli PRPS type A and type B filaments. (A) Type A filament ligands. The unit of E. coli PRPS type A filaments is hexamer with D3 symmetry. The hexamer has six identical ligand binding sites, one of which is shown in the figure. Different ligands are labeled with different colors. In type A filament, phosphate ion (Pi) binds to allosteric site 1, ADP binds to allosteric site 2 (red), and ATP binds to active site (brown). R5P also can be seen in the active site. (B) Type B filament ligands. The unit of type B filament is similar to that of type A filament, and one of the six identical ligand binding sites is shown here. In type B filament, the ATP binding site of active site is not bound by any ligand, while the R5P binding site and allosteric site 1 are bound by Pi. (C) Cryo-EM reconstruction of type A filament (C, 2.3 Å resolution). On the left is the electron density map of type A filament. On the right is the reconstruction structure of type A filament. The diameter and rise of type A filament are 110 Å and 63 Å, respectively. When hexamers are aggregated into type A filament, the adjacent hexamer us twisted by 27°. (D) Cryo-EM reconstructions of type B filament (2.9 Å resolution). On the left is electron density map of type A filament. On the right is the reconstruction structure of type A filament. The diameter of type B filament is same as that of type A filament. The rise and twist of type B filament are 66 Å and 46°, respectively.

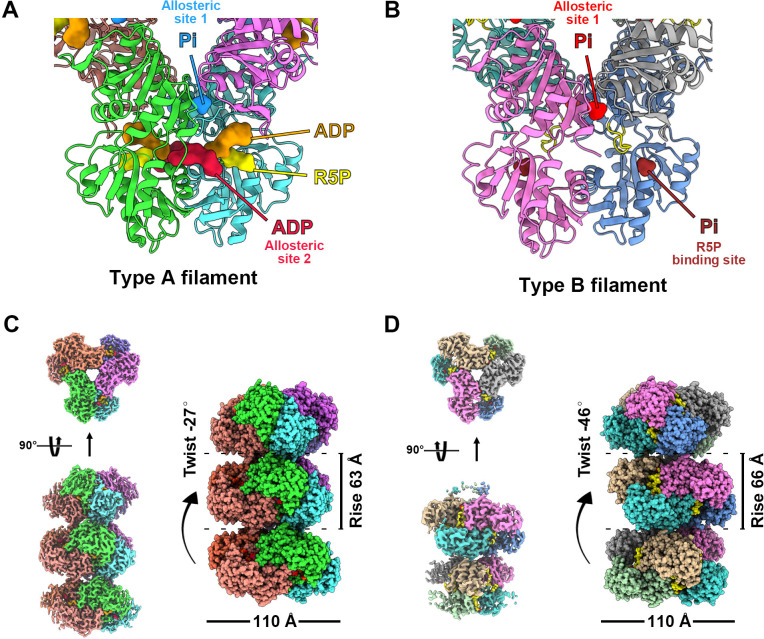
Figure 1.

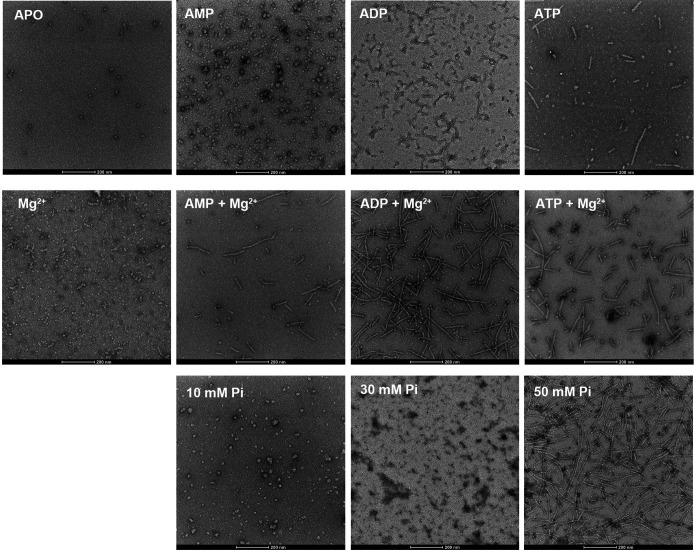
Figure 1—figure supplement 1. E. coli PRPS is assembled into filaments in vitro.

Figure 1—figure supplement 1.

Negative staining electron microscopic images of purified E. coli PRPS (1 μM) incubated in various conditions. The concentrations of nucleotides and Mg2+ are 2 mM and 10 mM, respectively.
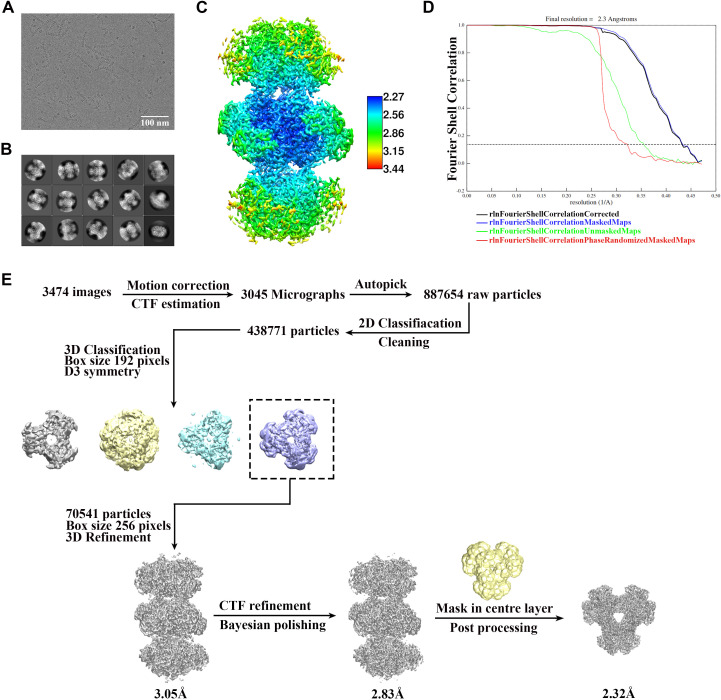
Figure 1—figure supplement 2. Cryo-EM data processing of PRPS type A filament.

Figure 1—figure supplement 2.

(A) Representative Cryo-EM image of PRPS type A filament. (B) Representative 2D averages of PRPS type A filament in different views. (C) Local resolution of the type A filament final density map. (D) Gold-standard FSC curves of central hexamer in type A filament density map (dash line shows FSC = 0.143). The final average resolution of hexamer is estimated to be 2.3 Å. (E) Flow chart of PRPS type A filament image processing.
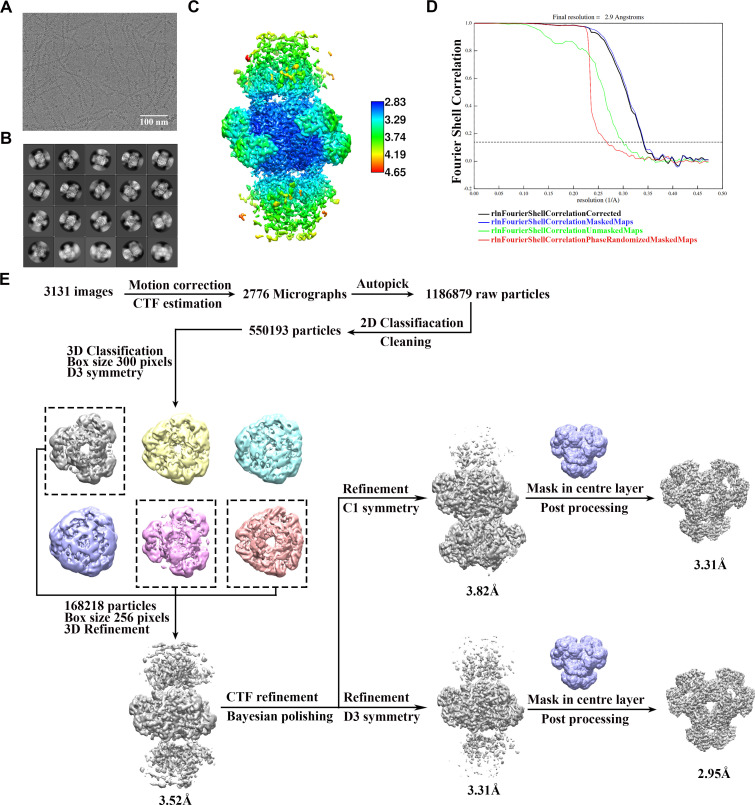
Figure 1—figure supplement 3. Cryo-EM data processing of PRPS type B filament.

Figure 1—figure supplement 3.

(A) Representative Cryo-EM image of PRPS type B filament. (B) Representative 2D averages of PRPS type B filament in different views. (C) Local resolution of the type B filament final density map. (D) FSC curves of central hexamer in type B filament density map (dash line shows FSC = 0.143). The final average resolution of hexamer is estimated to be 2.9 Å. (E) Flow chart of PRPS type B filament image processing.
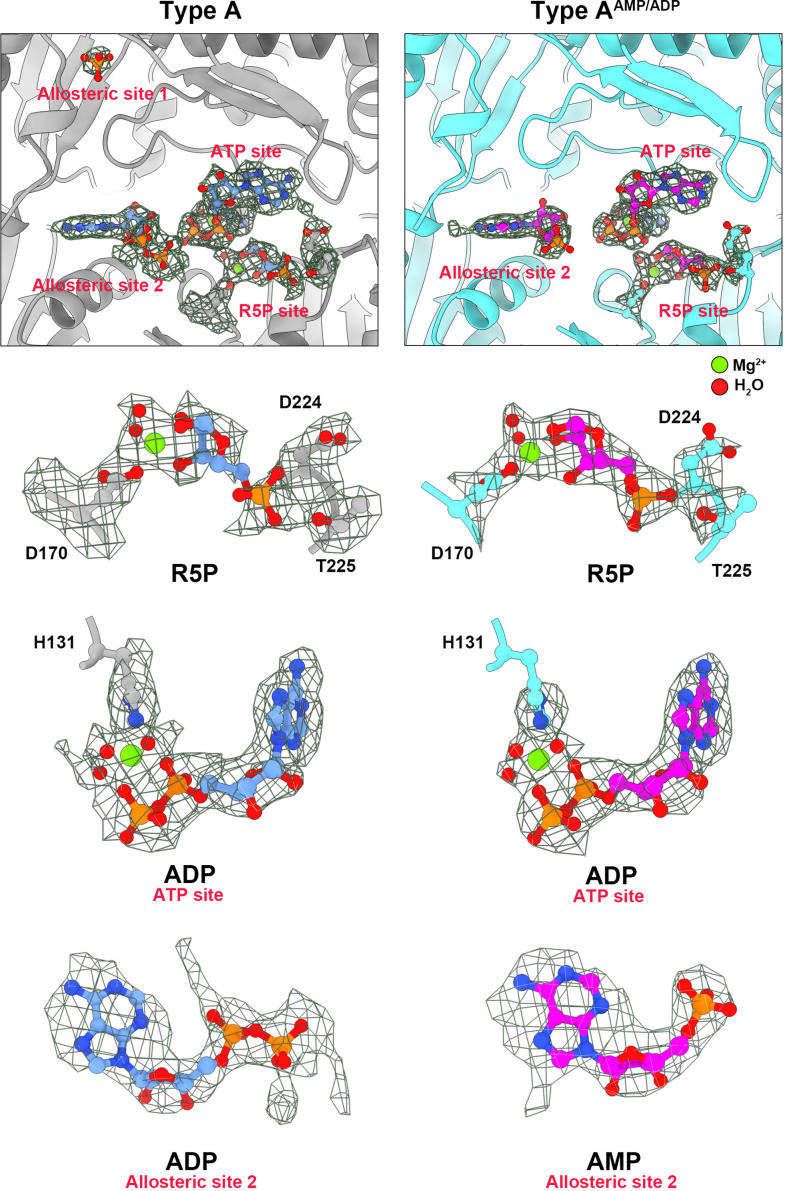
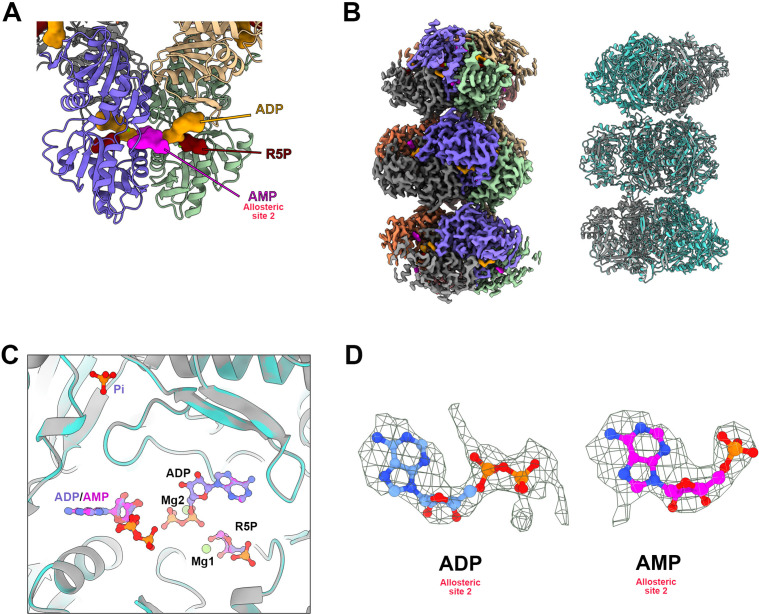
Figure 1—figure supplement 4. Electron density maps of type A and type AAMP/ADP in allosteric site and active site.

Figure 1—figure supplement 4.

On the left are ligands of type A filament (chains are gray). On the right are ligands of type A AMP/ADP filament (chains are cyan). All ligands in the electron density map are listed separately. Red spheres indicate H2O and green spheres indicate Mg2+.
Figure 1—figure supplement 5. Structure analysis of PRPS type AAMP/ADP filament.

Figure 1—figure supplement 5.

(A) The model of E. coli PRPS parallel dimer in type AAMP/ADP polymer . (B) Cryo-EM reconstruction of type AAMP/ADP (2.6 Å resolution) PRPS polymers (left). Comparison of overall structures of type A (gray) and type AAMP/ADP (cyan) filaments. (C) Comparison of ligands for type A (blue) and type AAMP/ADP (magenta) filaments. (D) Electron density map of ADP (type A) and AMP (type AAMP/ADP) in allosteric site 2.
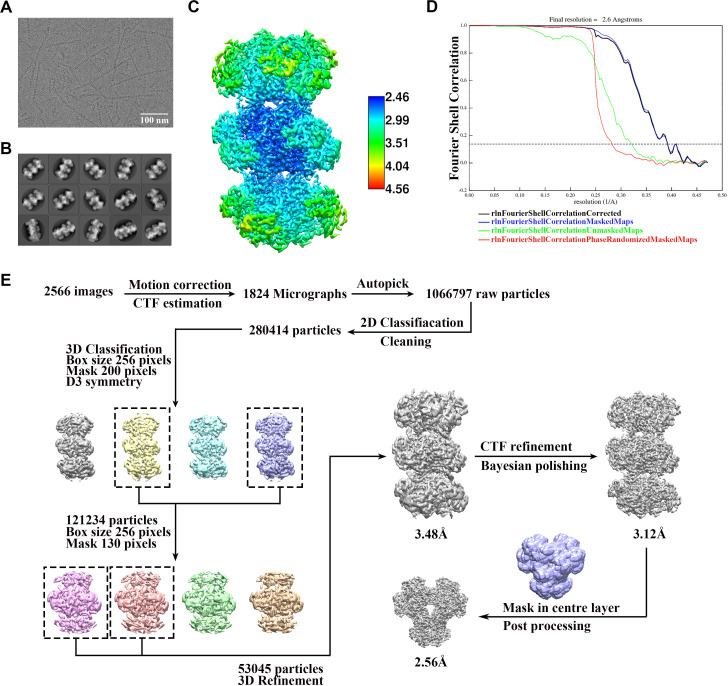
Figure 1—figure supplement 6. Cryo-EM data processing of PRPS type AAMP/ADP filament.

Figure 1—figure supplement 6.

(A) Representative Cryo-EM image of PRPS type B filament. (B) Representative 2D averages of PRPS type AAMP/ADP filament in different views. (C) Local resolution of the type B filament final density map. (D) FSC curves of central hexamer in type AAMP/ADP filament density map (dash line shows FSC = 0.143). The final average resolution of hexamer is estimated to be 2.6 Å. (E) Flow chart of PRPS type AAMP/ADP filament image processing.
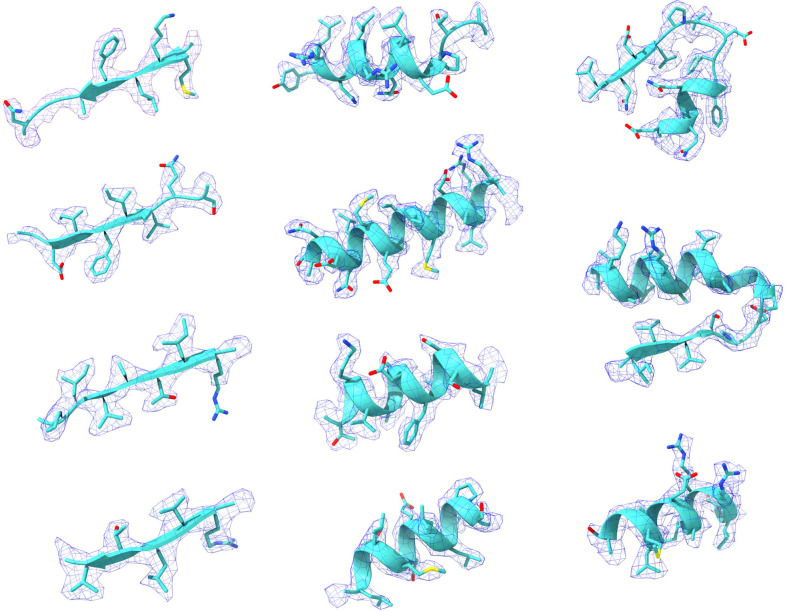
Figure 1—figure supplement 7. Representative Cryo-EM density maps of individual regions of the PRPS type A filament.

Figure 1—figure supplement 7.

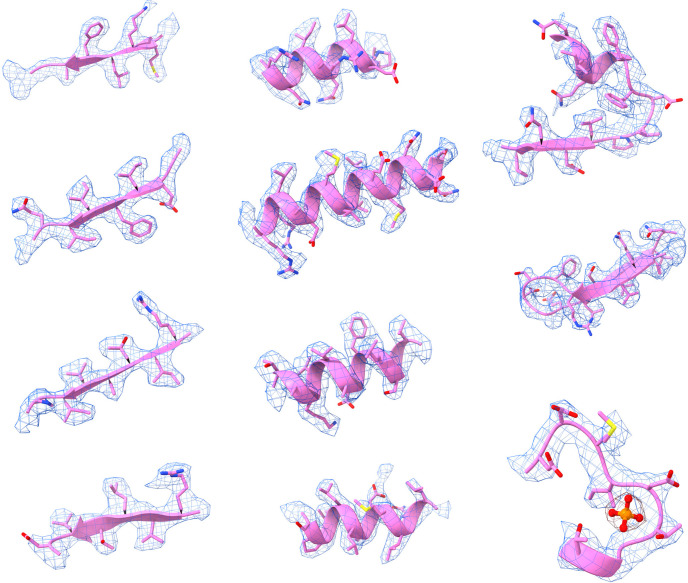
Figure 1—figure supplement 8. Representative Cryo-EM density maps of individual regions of the PRPS type B filament.

Figure 1—figure supplement 8.