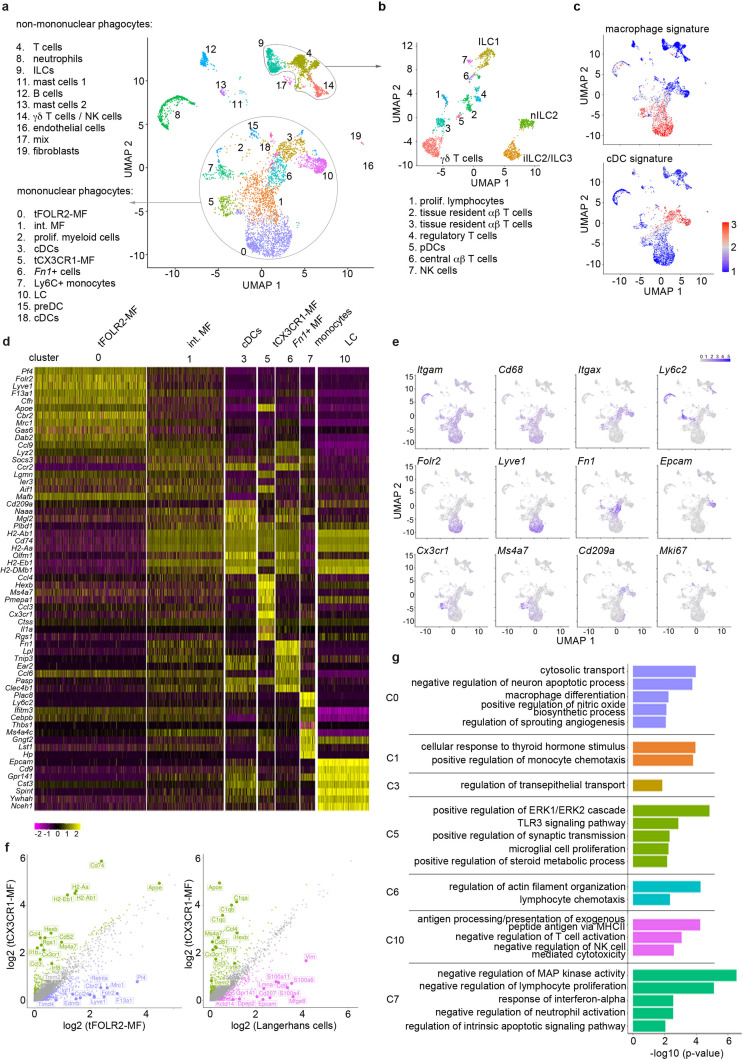
Figure 1. Single-cell sequencing characterization of leukocytes in the mouse tongue.
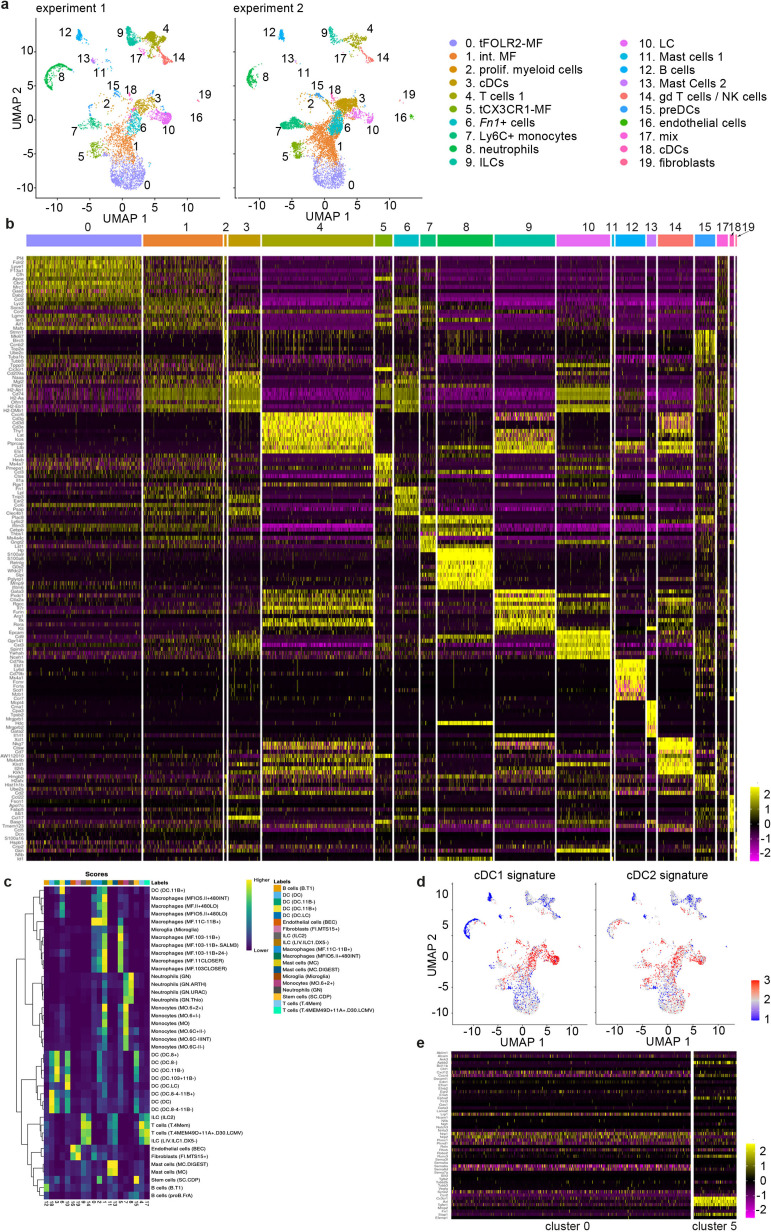
(a) UMAP representation of 6773 sequenced tongue leukocytes from adult, female Bl6 mice (pool of n=8 mice). Data from a biologically and technically independent experiment is shown in Figure 1—figure supplement 1a+b. Cluster annotation was performed with SingleR (Figure 1—figure supplement 1c). See Figure 1—source data 1+2 for complete gene lists and marker genes for all clusters. Abbreviations: ILCs (innate lymphoid cells); NK cells (natural killer cells); int. MF (intermediate macrophages); tFOLR2-MFs (tongue Folr2 +macrophages); cDCs (classical dendritic cells); tCX3CR1-MF (tongue Cx3cr1+macrophages); Fn1+ cells (Fn1-expressing mononuclear phagocytes); LC (Langerhans cells); preDC (pre-dendritic cells). (b) Separate UMAP representation of cells within cluster 4, 9, and 14. Additional abbreviations: pDC (plasmacytoid dendritic cells); nILC (natural ILC); iILC (induced ILC). (c) Gene Set Variation Analysis (GSVA) analysis was used for the discrimination of macrophages and dendritic cells. One signature gene list for macrophages (derived from Gautier et al., 2012) and one for cDC (derived from Schlitzer et al., 2015) were used to evaluate the enrichment score of each list in the 20 identified clusters. See also Figure 1—figure supplement 1d for cDC1 and cDC2 gene signatures and Figure 1—source data 3 for full gene lists. Cells with the highest similarity to each respective signature are labeled red. (d) Heatmap of top marker genes for the main mononuclear phagocyte clusters. See Figure 1—figure supplement 1b for a heatmap of marker genes for all clusters. (e) Expression pattern of example genes laid over the UMAP from a for dimension reduction. (f) Differentially expressed genes in tCX3CR1-MF vs. tFOLR2-MF (left) and tCX3CR1-MF vs. tongue Langerhans cells (right). Indicated genes show an increased expression of >1.5 with an adjusted p-value <0.05. (g) Gene ontology analysis of the differentially expressed genes of the main mononuclear phagocyte clusters. Only GO annotations involved in biological processes are shown and redundant pathways were excluded from this representation. See Figure 1—source data 4 for full list of GO terms per cluster.


