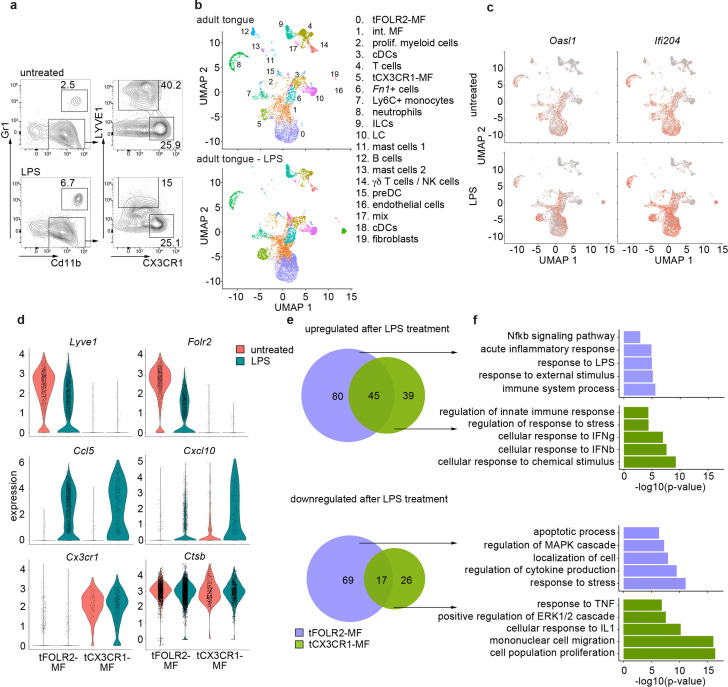
Figure 4. Inflammatory response of tongue macrophages to systemic LPS challenge.
(a) Female Bl6 mice were intraperitonally injected with 1 mg/kg LPS and analyzed 6 hr after injection by flow cytometry. Note the absence of LYVE1 surface expression in CD11b+ CD64+ tongue macrophages after LPS treatment. The experiment was performed twice with n=3–6 animals. (b) Tongue CD45+ leukocytes were FACS purified 6 hours after injection of LPS and subjected to scRNA-seq (pool of 6 mice). In total, 8165 LPS-exposed tongue leukocytes were sequenced and the data was integrated into the untreated adult analysis shown in Figure 1 for population comparison. Shown are UMAPs for untreated adult cells (top) and LPS-treated cells (bottom). (c) Gene expression pattern of Oasl1 and Ifi204 in untreated and LPS-treated tongue leukocytes. (d) Violin blots showing marker gene expression patterns in untreated (red) and LPS treated (green) tFOLR2-MF and tCX3CR1-MF. (e) Number of up- and down-regulated genes in tFOLR2-MF (violet) and tCX3CR1-MF (green) after LPS injection. The full list of DEGs can be found in Figure 4—source data 1. (f) GO enrichment analysis of the DEGs. Only GO annotations involved in biological processes are shown.

