. 2022 Jun 24;11:e77490. doi: 10.7554/eLife.77490

Figure 6. Transcriptomic analysis of hematopoietic tongue cells from newborn mice.

(a) CD45+ tongue leukocytes were isolated by FACS from newborn p3 mice. The purified cells were subjected to scRNA-seq and a total of 13,898 cells were sequenced. The early postnatal data was integrated with the adult scRNA-seq dataset shown in Figure 1 for population comparison. Shown are UMAPs for adult (left) and newborn cells (right). (b) Cell frequencies for each cell cluster in adult and newborn mice. Note that the adult analysis included enrichment for LC using a different cell isolation protocol that was not done for the p3 pup analysis (see Materials and method section) and cluster 10 LC are therefore probably underrepresented in p3 tongues. (c) Expression levels of example genes in newborn cells shown in the UMAP. (d) 3D UMAP visualization reveals the merging of proliferating cluster 2 cells with cluster 0 cells. The 3D html file is provided in Figure 6—source data 1. (e) Slingshot analysis was used to model the developmental trajectories of tongue macrophages. See also Figure 6—figure supplement 1+2 for gene differences between newborn and adult tongue macrophages. (f) In vivo EdU proliferation assay of adult and newborn tongue leukocytes. EdU was injected and tongue cells were isolated 24 hr after injection. Representative FACS gating strategy for macrophages at each age shown above and quantification of EdU+ cell fraction shown below. Each dot in the quantification represents one independent animal (n=5). This experiment was performed once. (g) CD45.2/2 animals were lethally irradiated (9.5 Gy) and reconstituted with CD45.1 expressing bone marrow cells. Five weeks and 10 weeks after transfer, tongue cells were isolated and analysed by flow cytometry for the distribution of CD45.1+ cells within the macrophage subsets. Each dot represents one independent animal. This experiment was performed once.

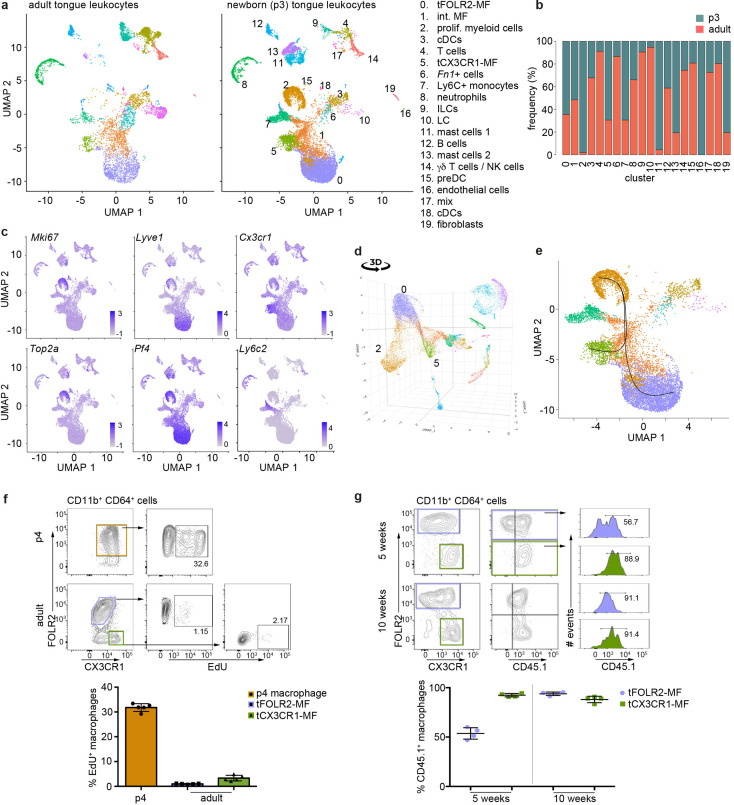
Figure 6—source data 1. 3D UMAP.
This html file shows the 3D representation of the postnatal day 3 UMAP represented in Figure 6.

Figure 6.

Figure 6—figure supplement 1. Gene expression differences in tongue macrophages at p3 and adult stages.

Figure 6—figure supplement 1.

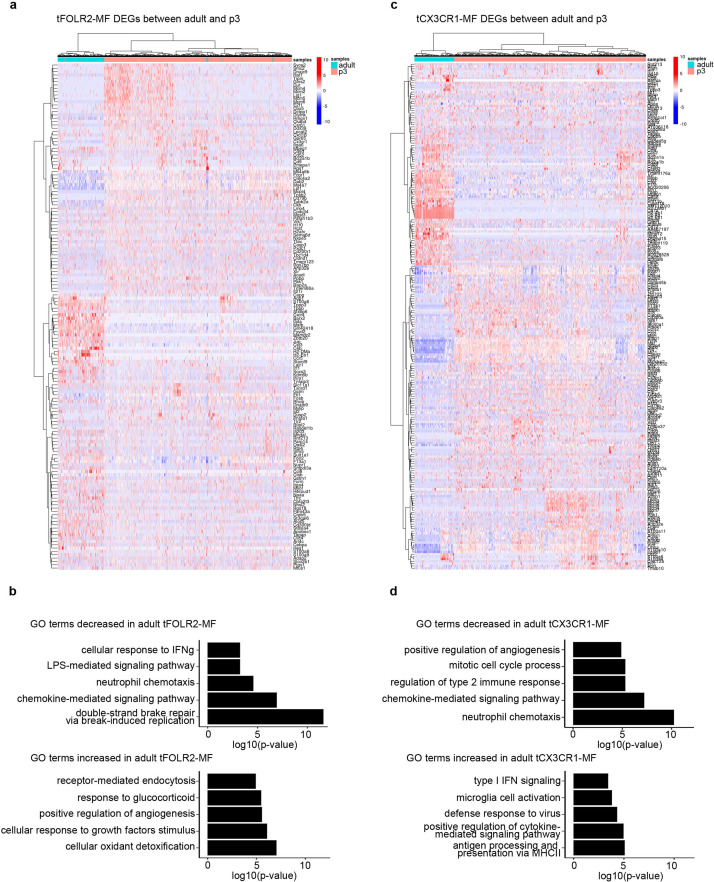
(a) Differentially expressed genes between p3 and adult tFOLR2-MF. Shown are all significantly changed genes that passed variance analysis. No fold-change filter was applied to the analysis. (b) GO enrichment analysis of biological processes that differ between p3 and adult tFOLR2-MF. Redundant terms are excluded. (c) Differentially expressed genes between p3 and adult tCX3CR1-MF. Shown are all significantly changed genes that passed variance analysis. No fold-change filter was applied to the analysis. (d) GO enrichment analysis of biological processes that differ between p3 and adult tCX3CR1-MF. Redundant terms are excluded.
Figure 6—figure supplement 2. The maturation pattern of tFOLR2-MF and tCX3CR1-MF in adult tongues.

Figure 6—figure supplement 2.

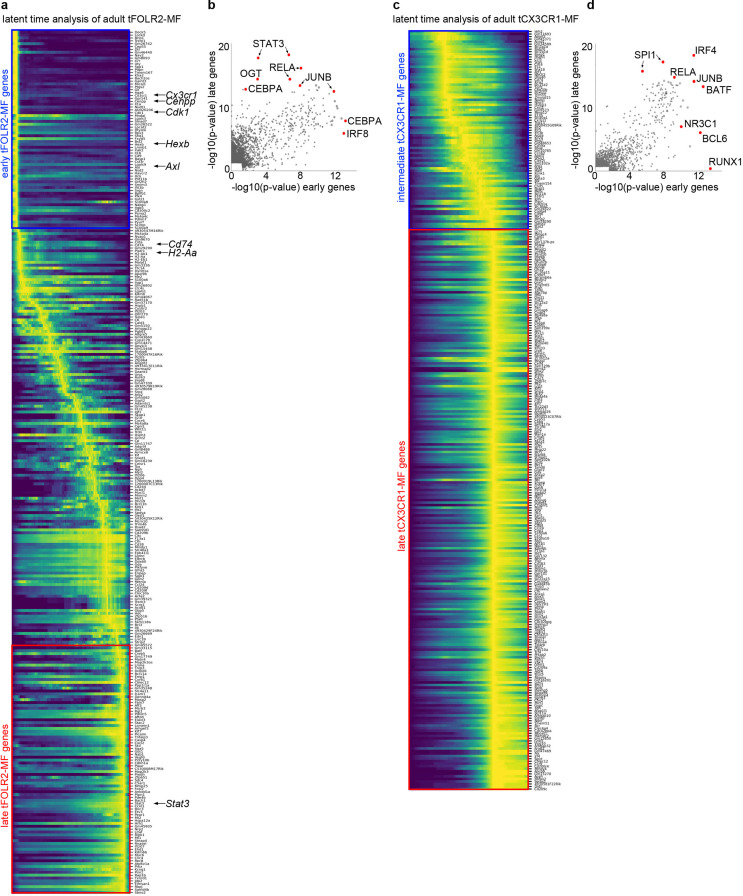
(a) Latent time analysis reveals distinct gene expression patterns in adult tFOLR2-MF. Note the gradual down-regulation of MHC-related genes (for example, H2–Ab1, H2–Aa, Cd74), proliferation-associated genes (for example, Cdk1, Cenpp) and genes that are highly expressed in tCX3CR1-MF (e.g. Cx3cr1, Hexb, Axl). Early (blue) and late (red) expressed genes that were used in (b) are marked with a rectangle. (b) We used Lisa Cistrome (Qin et al., 2020) (http://lisa.cistrome.org/) to investigate public chromatin profile data from a comprehensive database of mouse H3K27ac ChIP-seq profiles to determine transcription factors that are possibly responsible for the regulation of early and late expressed tFOLR2-MF genes. Note that early expressed tFOLR2-MF genes (blue genes in (a)) show preferential binding motifs of IRF and CEBP proteins similar to tCX3CR1-MF, while genes that are expressed in more mature tFOLR2-MF are enriched for STAT3 and OGT motifs. (c) Latent time analysis of adult tCX3CR1-MF. No clear maturation pattern could be extracted. Intermediate (blue) and late (red) expressed genes that were used in (d) are marked with a rectangle. (d) Lisa analysis of intermediate and late expressed tCX3CR1-MF gene sets as shown in (c). Both intermediate and late gene data sets showed a significant enrichment for IRF, RELA, JUNB, and BATF motifs. While intermediate genes showed binding motifs for RUNX1, BCL6, and NR3C1, the late gene set was only weakly enriched for SPI1 motifs.
Figure 6—figure supplement 3. Irf8-deficiency does not affect the tongue leukocyte composition.

Figure 6—figure supplement 3.

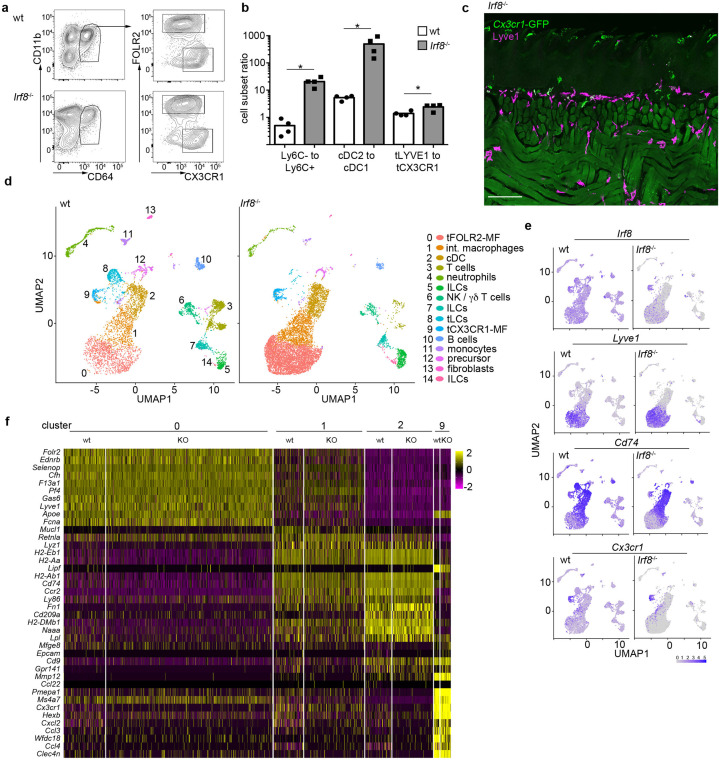
(a) Exemplary flow cytometry analysis of Irf8-deficient tongue leukocytes and their respective controls. The cells were pre-gated as CD11b+ CD64+. (b) Ratio analysis of Ly6C- monocytes / Ly6C+ monocytes, splenic cDC2 /cDC1 cells and tFOLR2-MF / tCX3CR1-MF isolated from WT and Irf8-deficient mice (n=4). Each dot represents one animal. The experiment was repeated three times with similar results. Unpaired Student’s T-Test was used to determine significance. * indicates p<0.05. (c) Histological analysis of an adult Cx3cr1Gfp/+ Irf8-/- tongue reveals the presence of Cx3cr1-GFP+ tCX3CR1-MF in the lamina propria. Sections were stained with anti-GFP (green) and anti-LYVE1 (violet) antibodies. The experiment was repeated three times. (d) 9047 CD45+ cells were profiled from adult Irf8-deficient mice (pool of n=5 mice) by scRNA-seq. Shown are UMAP dimension reductions of WT (left) and Irf8-deficient CD45+ tongue cells (right). Note that the Irf8-deficient data was separately integrated with WT cells and therefore reveals different clustering results than those shown in main Figures 1, 4 and 5 and Figure 1—figure supplement 1. (e) Gene expression examples in wt and Irf8-deficient cells. Note that Irf8 transcripts can be detected on mRNA level in Irf8-deficient mice since only exon 2 of the Irf8 gene is deleted in the Jackson strain 018298. (f) Heatmap of marker gene expression for clusters 0, 1, 2, and 9 in wildtype and Irf8-deficient cells.