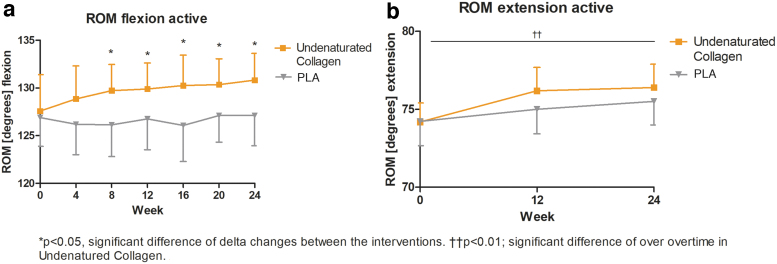
FIG. 2.
Distribution of ROM results for (a) ROM flexion active (°); (b) ROM extension active (°) in the undenatured collagen group versus PLA group over the study; line graph with mean ± 95% CI; *p < 0.05, significant difference of delta changes between the interventions. ††p < 0.01; significant difference over time in undenatured collagen. CI, confidence interval; ROM, range of motion; PLA, placebo.

