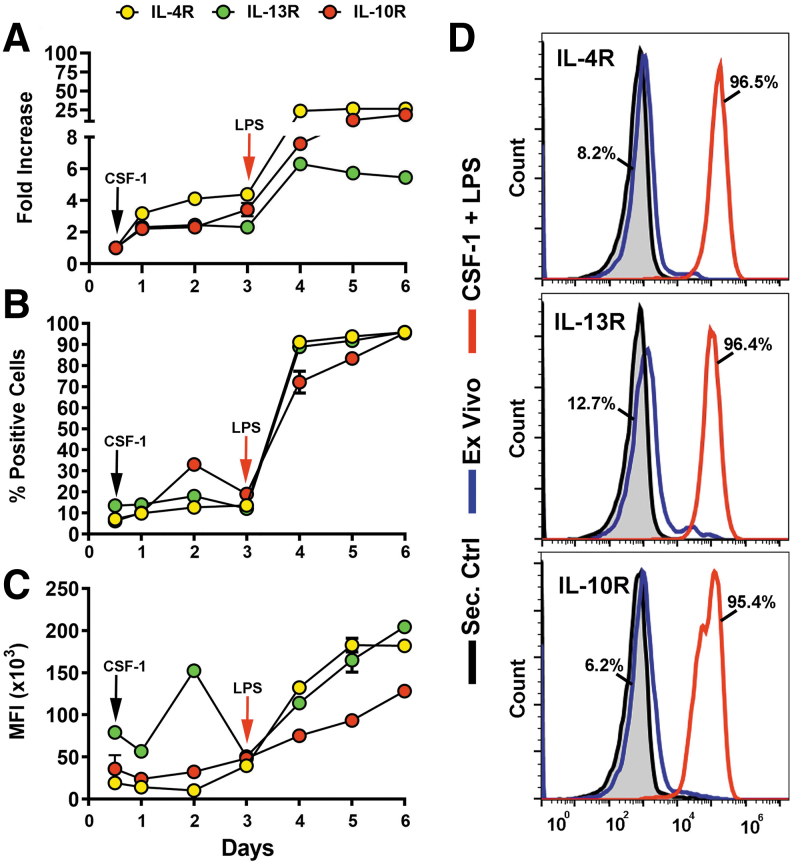
FIG. 1.
Upregulation of IL-4R, IL-13R, and IL-10R during CSF-1/LPS induced differentiation of M-LECP. Mouse BM cells were differentiated with CSF-1 followed by LPS as described under Materials and Methods section. Transcripts and protein levels of IL-4R, IL-13R, and IL-10R were determined daily by qPCR (A) and flow cytometry (B–D), respectively. Quantitative PCR data in (A) are presented by fold increase of target transcripts in differentiated M-LECP compared with ex vivo cells. Values represent the mean ± SD of triplicate or duplicate for qPCR and flow cytometry analyses, respectively. (B, C) Mean percent of positive cells and MFI for each target were determined daily. Note that some SD bars are not visible due to their smaller size compared with the symbol. (D) Representative histograms of IL-4R, IL-13R, and IL-10R protein expression in ex vivo (blue lines) and differentiated (red lines) cells. The black line represents cells stained with secondary antibody alone. Percent of positive ex vivo and differentiated cells are indicated for each target. All analyses were reproduced three times. BM, bone marrow; LPS, lipopolysaccharide; M-LECP, myeloid-lymphatic endothelial cell progenitor; MFI, mean fluorescent intensity.

