Figure 3.
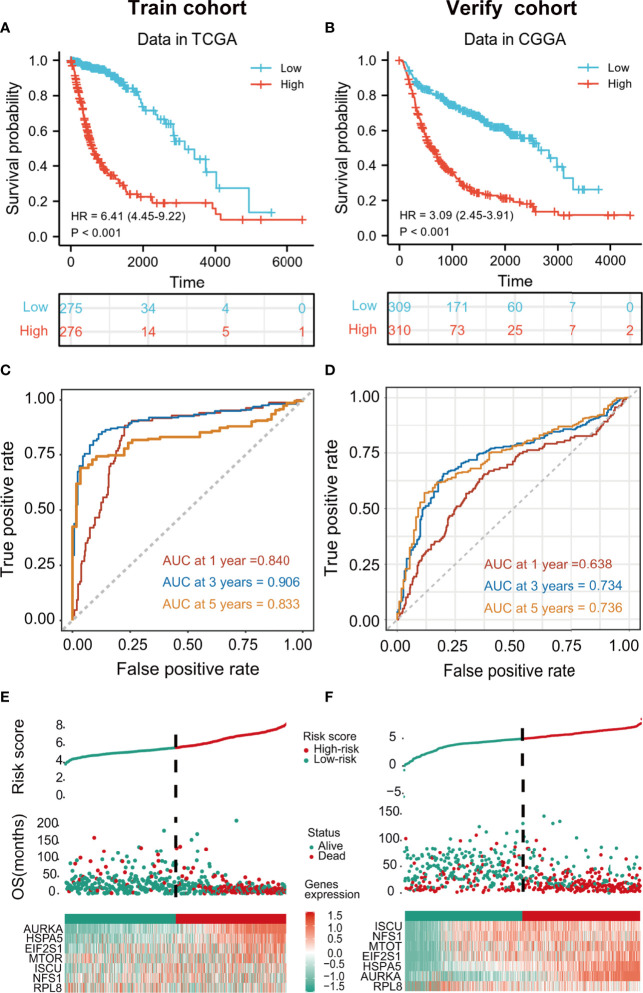
Kaplan-Meier curves showing risk scores of FRG signature genes in both training and validation cohorts (p < 0.001) (A, B). tROC curves for one-, three- and five-year survival (C, D). Heatmaps of risk score rankings, survival, and levels of cancer-essential FRGs in the training and validation cohorts (E, F).

