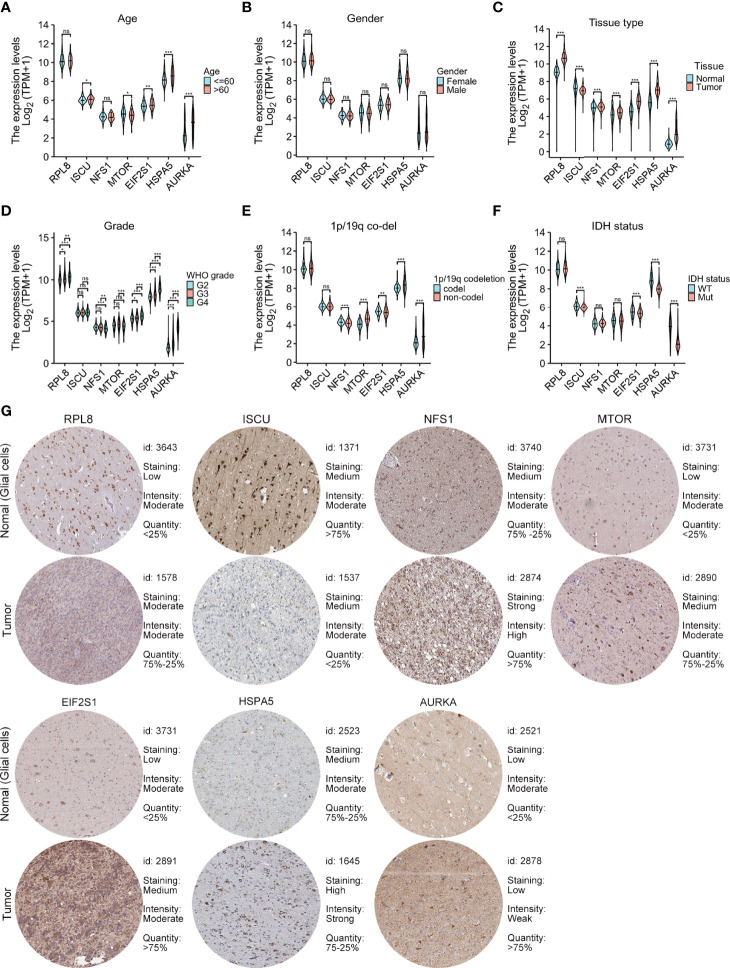
Figure 4.
Relationships between the levels of the seven cancer-essential FRGs and clinical features. Age (A), sex (B), normal versus tumor tissue (C), WHO grade (D), 1p/19q co-deletion status (E), and IDH status (F). Immunohistochemistry showing the protein expression of risk model genes in normal and tumor specimens of The Human Protein Atlas (G). ns, p≥0.05, *p < 0.05, **p < 0.01, ***p < 0.001.

