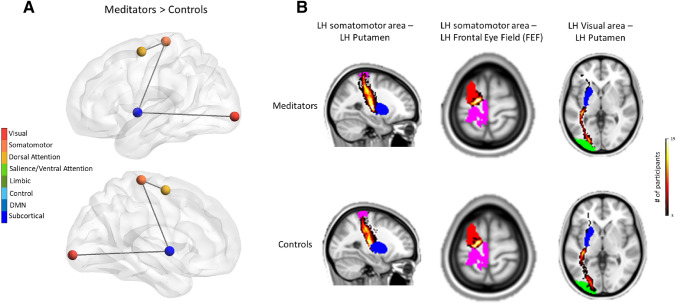
Fig. 6.
Increased network-related SC in the meditator group compared to the control group. A The significant network resulting from the contrast meditators > controls, comprising three edges and four nodes, is represented from a lateral view of the left hemisphere. Nodes are colored according to the hue of the network they belong to as displayed in the legend on the left side. B Visualization of the three pathways found to have increased connectivity in the meditator group. ROIs are colored as follows: blue for left putamen, pink for left somatomotor, red for frontal eye field (FEF), and green for left visual area. Pathways are colored according to the number of participants that have a tract passing through the voxel, with yellow representing the heighest value and black the smallest, as represented in the legend on the right side of the figure

