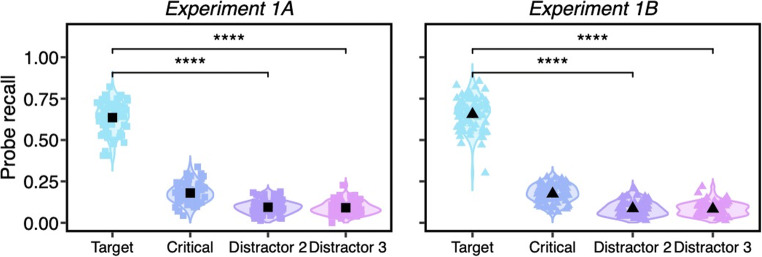
Fig. 2.
The percentages of probe letters reported at the target, critical distractor and non-critical distractor (Distractor 2 and Distractor 3) locations on guidance probe trials. Trials included in these analyses were ones in which only one letter was reported, and the letter was present in the probe array, which represented 88% or more of the guidance probe trials. The colored dots represent individual data points, and the black ones indicate the mean values. All error bars are the 95% confidence intervals (Color figure online)

