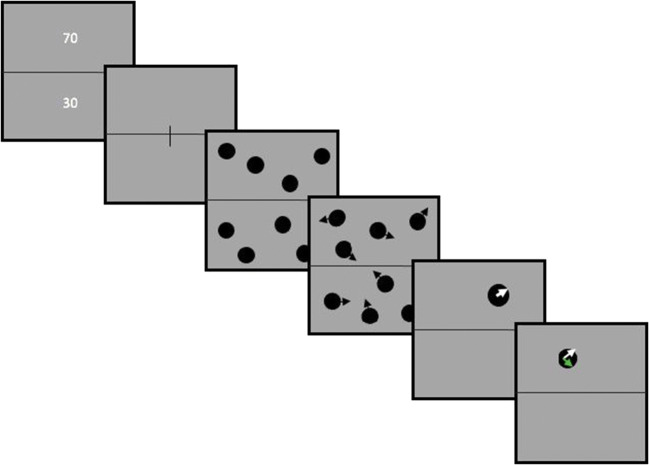
Fig. 1.
Trajectory tracking task timeline. At the beginning of the trial, numbers representing the likelihood of the “queried” item appeared in the upper or in the lower region of the screen, respectively. These numbers were either 70-30, 30-70 or 50-50. Then numbers disappeared and fixation line was presented. Subsequently, eight discs appeared on the screen, four in the upper and four in the lower regions of the screen. Then discs started moving around the screen without crossing the horizontal boundary (the black arrows were not presented on the screen but are used here to represent movement). After period of movement all discs disappeared, except one (which was either in the upper or in the lower screen region based on the probe probability of each region). Participants were then asked to click on the direction they thought the disc was going. After participants’ response, feedback was presented on the screen. A green arrow appeared indicating the target’s correct trajectory. (Colour figure online)

